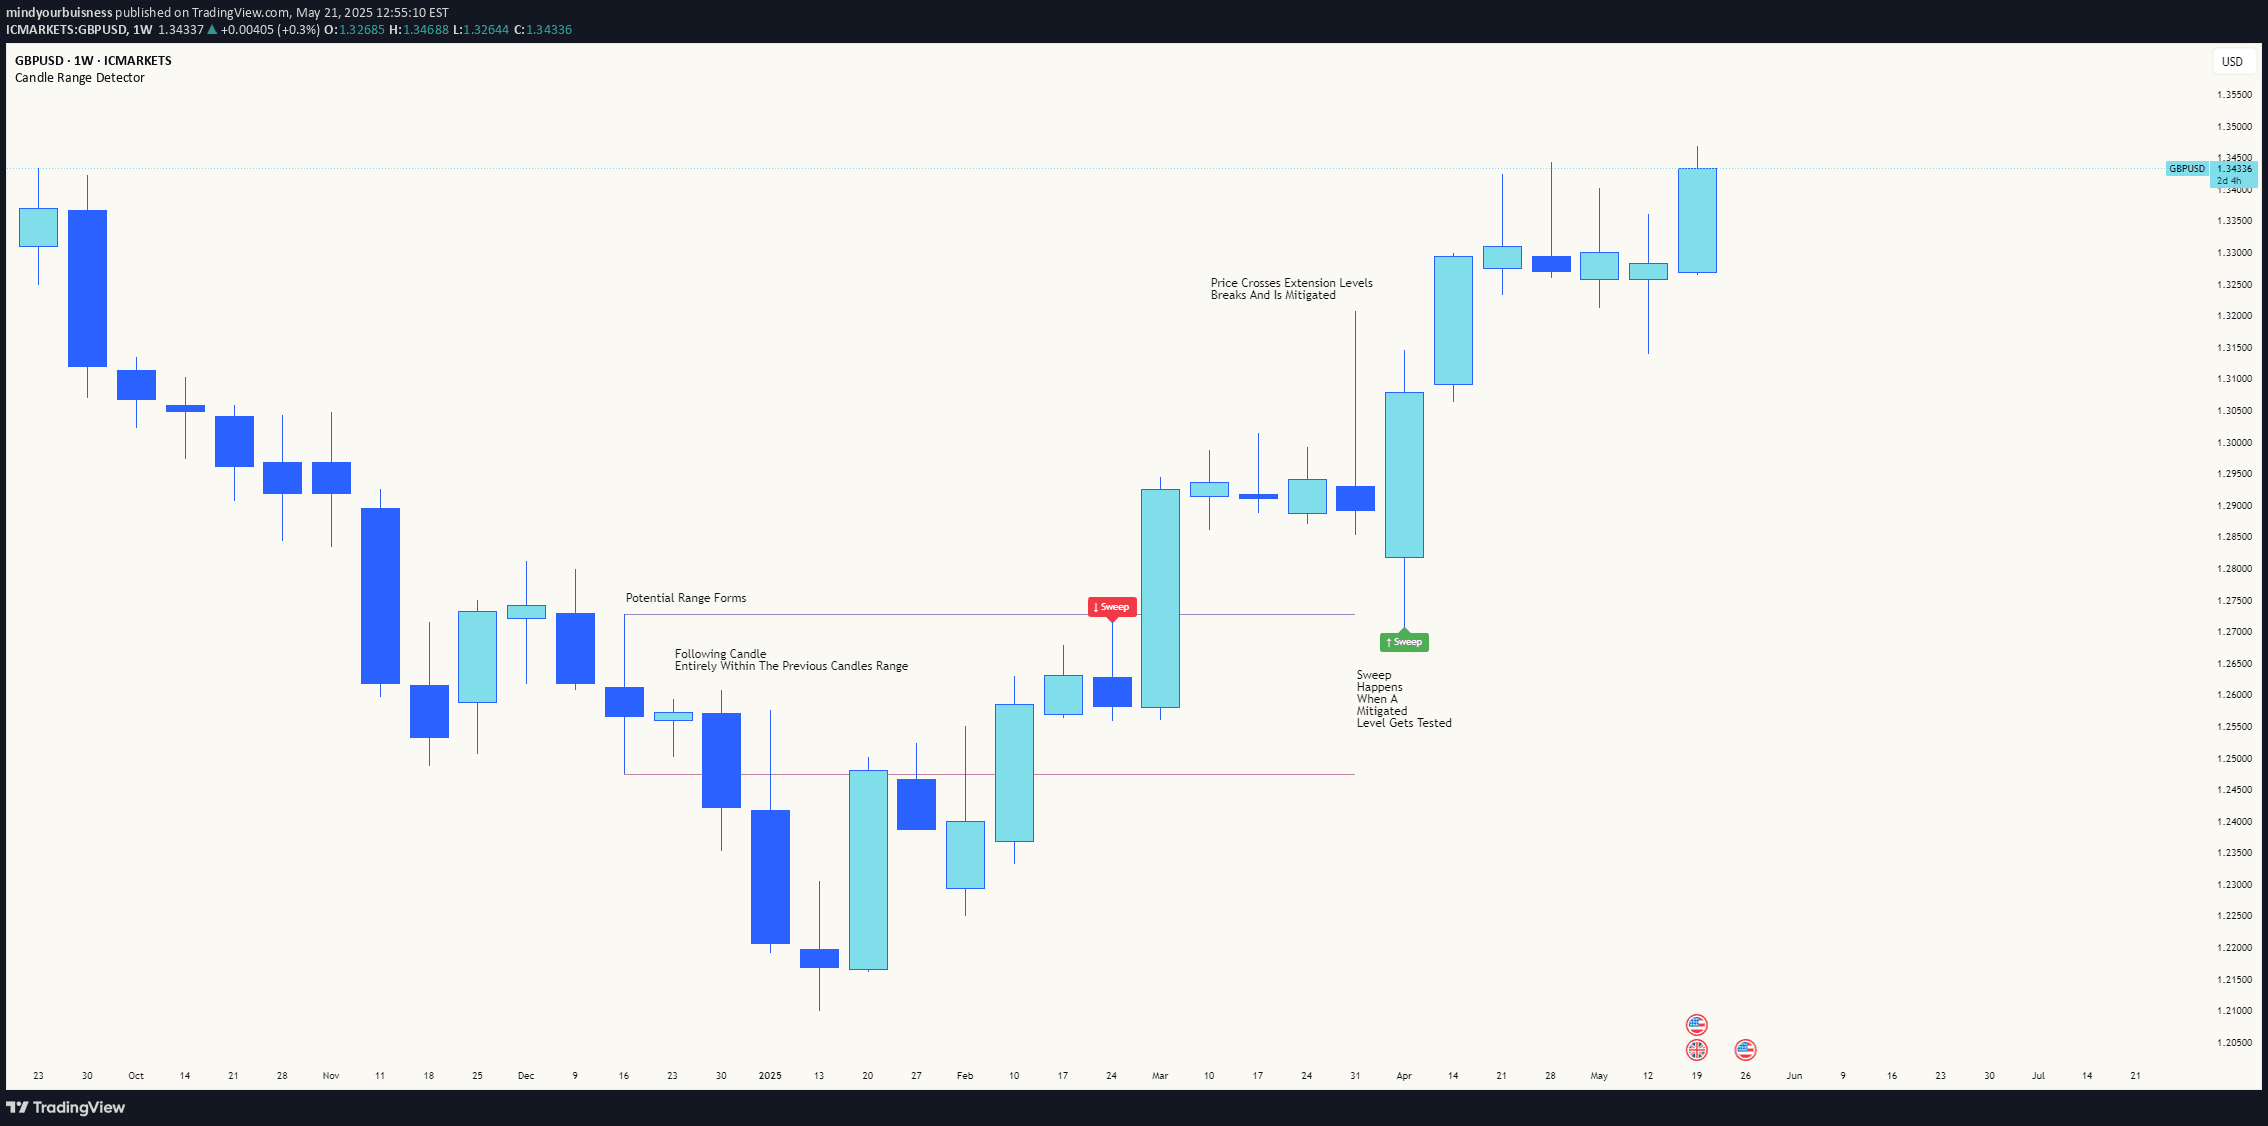
Sebastine Gap Detector Indicator helps traders identify and monitor price gaps, providing visual markers and horizontal lines to track potential trading opportunities.
Explore complementary indicator rolesHow it works
The Sebastine Gap Detector Indicator automatically scans price charts to identify and mark gap openings during trading sessions. Once a gap is detected, the indicator draws horizontal lines across the trading day, creating visual markers that highlight the gap's location and extent.
These horizontal lines serve as a constant reference point, helping traders track the gap's potential movement and significance. The indicator uses customizable parameters such as gap size tolerance and line style preferences, allowing traders to adapt the tool to their specific trading strategy and asset class.
Why it may be useful
Gap openings represent critical moments in financial markets that can signal potential trading opportunities or significant market shifts. By providing clear visual indicators of these gaps, traders can quickly recognize and analyze potential price movements that might otherwise go unnoticed.
The indicator empowers traders with enhanced market awareness, helping them make more informed decisions by highlighting areas where price tends to revisit or fill. This visual tool transforms complex market information into an easily digestible format, reducing the cognitive load of manually tracking and interpreting price gaps.
When to explore it
The Sebastine Gap Detector is most effective during volatile market conditions where price gaps are more likely to occur, such as during market open, after earnings reports, or following significant economic news releases. Traders can benefit from using this indicator in fast-moving markets where quick identification of price anomalies can provide a competitive edge.
The indicator is particularly useful for day traders and scalpers who rely on short-term price movements and need rapid insights into market dynamics. It works best when combined with other technical analysis tools and when traders have a solid understanding of gap behavior and potential market reactions.
Keep exploring
What we’ve verified
Access, alerts and repainting behaviour have not been independently verified for this indicator. Check the creator’s current publication and settings.
General descriptions and classifications are recovered research. Verified details above identify the specific checks we have completed. Check the creator’s current publication for later changes.