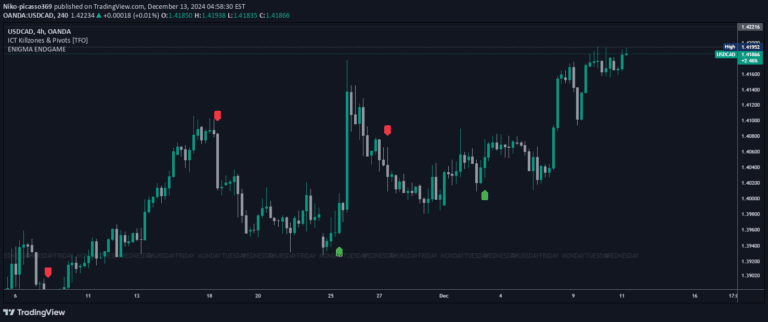
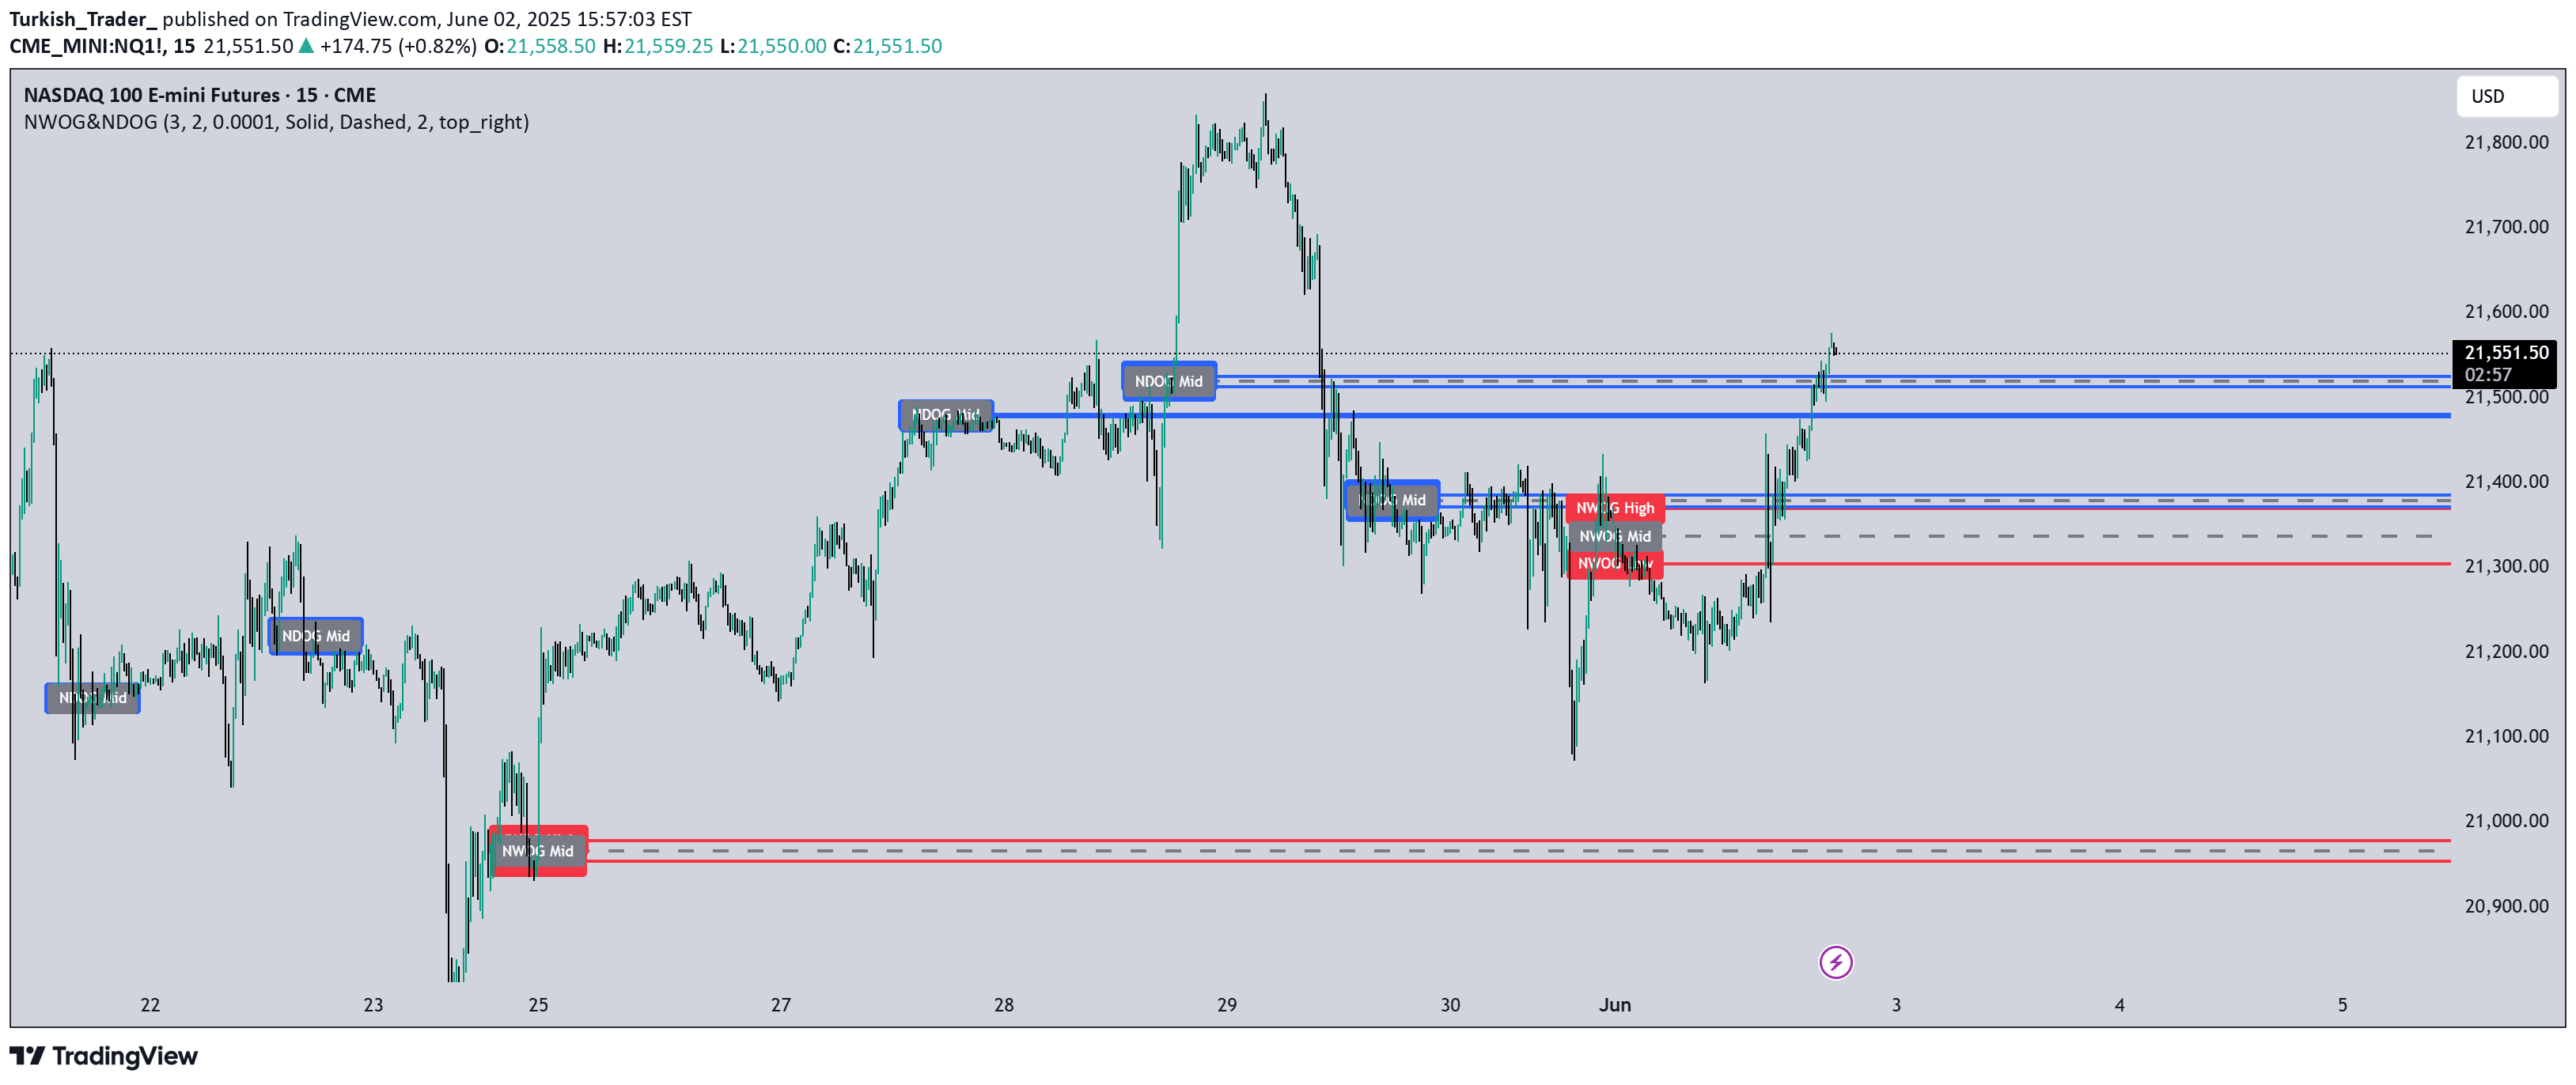
A custom TradingView indicator that displays percentage-based price levels relative to the previous candle's close, helping traders identify potential support and resistance zones.
Explore complementary indicator rolesHow it works
The Percentage Ruler indicator calculates horizontal lines at predefined percentage levels ranging from -5% to +5%, anchored to the previous candle's closing price. These lines are dynamically generated and extend to the right edge of the chart, providing a visual representation of potential price movement zones.
By using the previous candle's close as a reference point, the indicator creates a consistent and adaptable framework for analyzing potential price levels. The lines are color-coded with green representing positive percentages and red representing negative percentages, making it easy for traders to quickly interpret potential support and resistance zones.
Why it may be useful
The Percentage Ruler offers traders a quick and intuitive method to assess potential price movement ranges based on percentage calculations. By providing a visual representation of percentage levels, traders can rapidly identify potential support and resistance zones without complex calculations or additional tools.
This indicator is particularly valuable because it simplifies price level analysis and provides a clear, uncluttered view of potential price movement zones. Traders can quickly gauge potential price ranges and make more informed decisions about entry, exit, and risk management strategies.
When to explore it
The Percentage Ruler is most effective in markets with clear trending or range-bound characteristics, where percentage-based price movements are more predictable. It works well across various timeframes, from short-term scalping to longer-term swing trading, making it a versatile tool for different trading strategies.
Traders should use this indicator in conjunction with other technical analysis tools to confirm potential price levels and validate trading decisions. It is particularly useful during periods of market consolidation or when looking to establish quick reference points for potential price targets and support/resistance zones.
Keep exploring
What we’ve verified
Access, alerts and repainting behaviour have not been independently verified for this indicator. Check the creator’s current publication and settings.
General descriptions and classifications are recovered research. Verified details above identify the specific checks we have completed. Check the creator’s current publication for later changes.