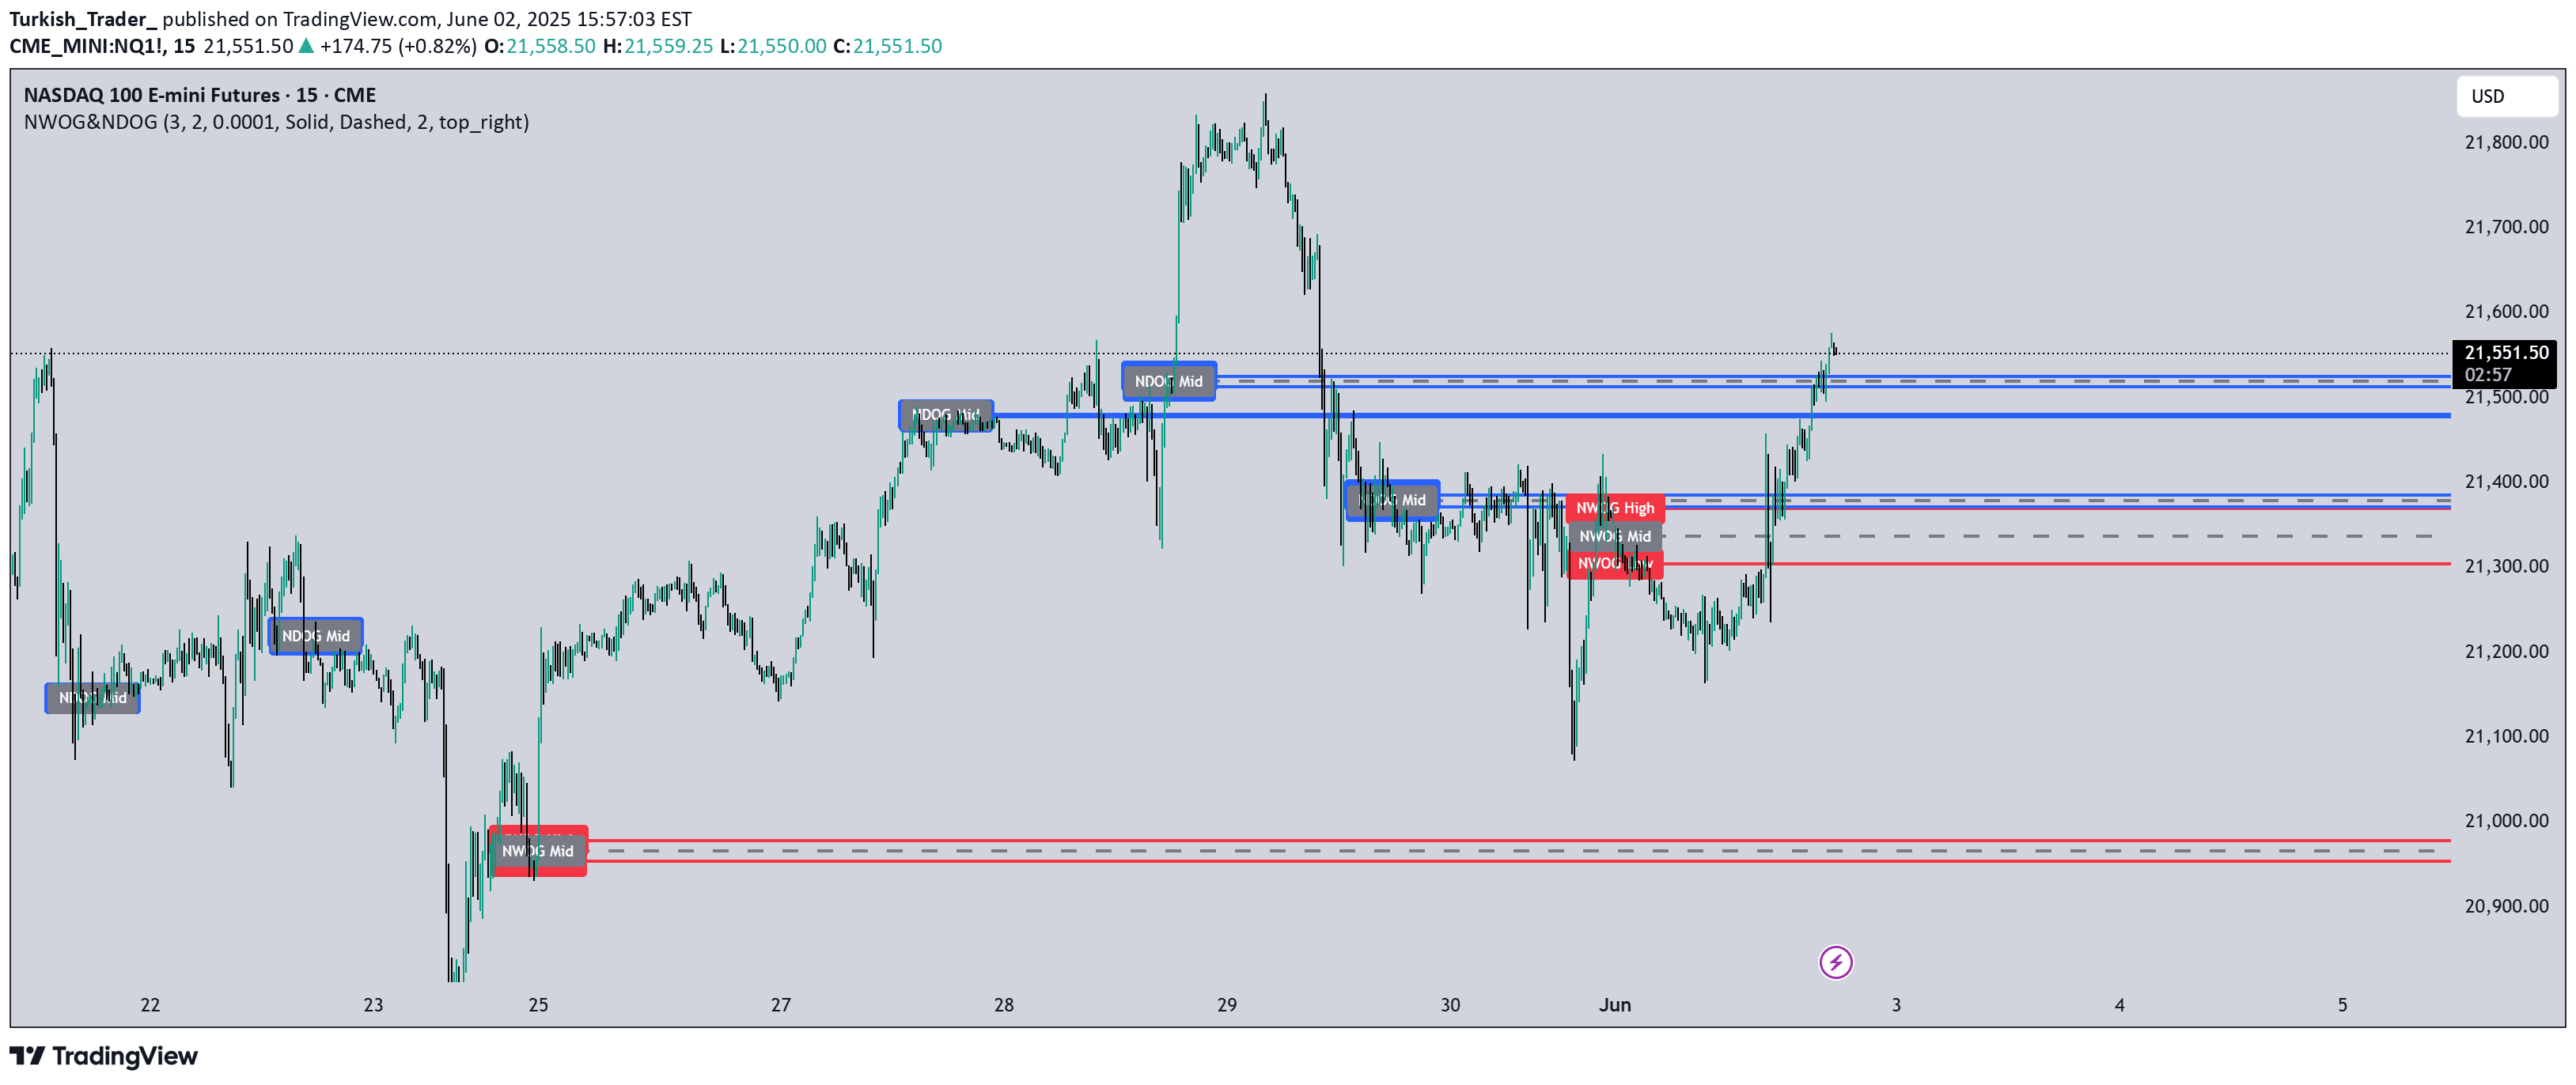
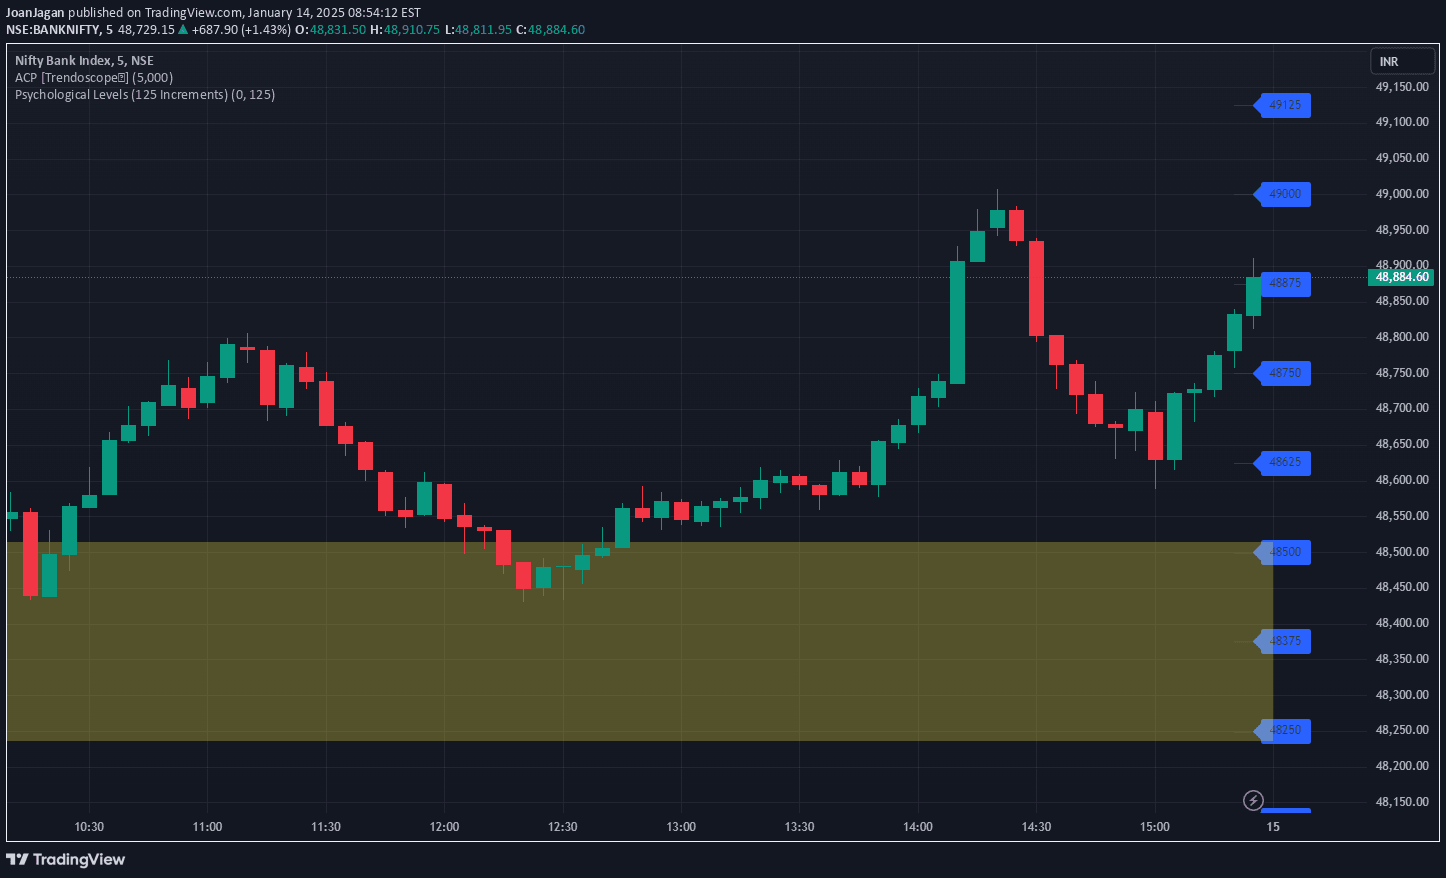
A trading indicator that plots critical historical price levels like previous day/week highs and lows, and current trading period opening prices to help identify potential support and resistance zones.
Explore complementary indicator rolesHow it works
The indicator automatically calculates and plots key historical price levels by tracking previous trading sessions' high and low points. It identifies the previous day's high and low, previous week's high and low, and the opening prices for the current day, week, and month.
These levels are displayed as horizontal lines on the right side of the chart, with customizable colors and optional visibility for each specific level. Traders can easily toggle which levels they want to see and adjust the visual presentation to suit their analytical preferences.
Why it may be useful
Historical price levels provide crucial insights into market psychology and potential support and resistance zones where price might stall or reverse. By showing previous trading session boundaries, traders can better understand potential areas of market interest and psychological price points.
These levels help traders make more informed decisions by highlighting key reference points that reflect past trading behavior. They offer a structured approach to identifying potential entry, exit, and stop-loss points based on recent market movements and established trading ranges.
When to explore it
These levels are most effective in markets with clear directional movements and during times of predictable trading patterns. They work exceptionally well in liquid markets like forex, major stock indices, and heavily traded commodities where historical price levels tend to have more significance.
Traders should use these levels in conjunction with other technical analysis tools to confirm potential trade setups. They are particularly useful during ranging markets, breakout scenarios, and when analyzing potential support and resistance zones across different timeframes.
Keep exploring
What we’ve verified
Access, alerts and repainting behaviour have not been independently verified for this indicator. Check the creator’s current publication and settings.
General descriptions and classifications are recovered research. Verified details above identify the specific checks we have completed. Check the creator’s current publication for later changes.