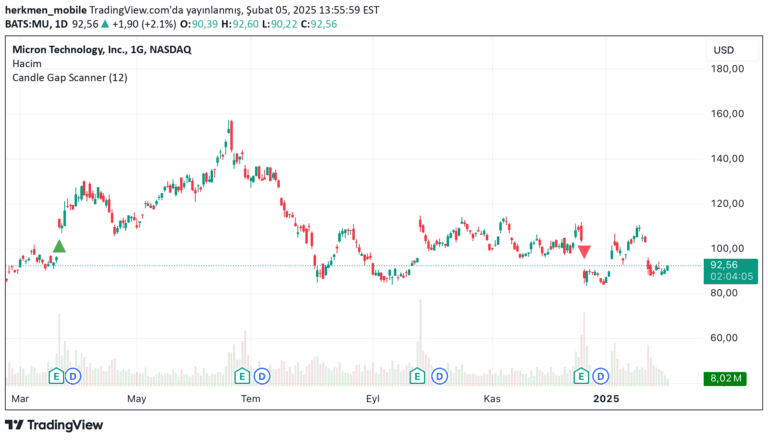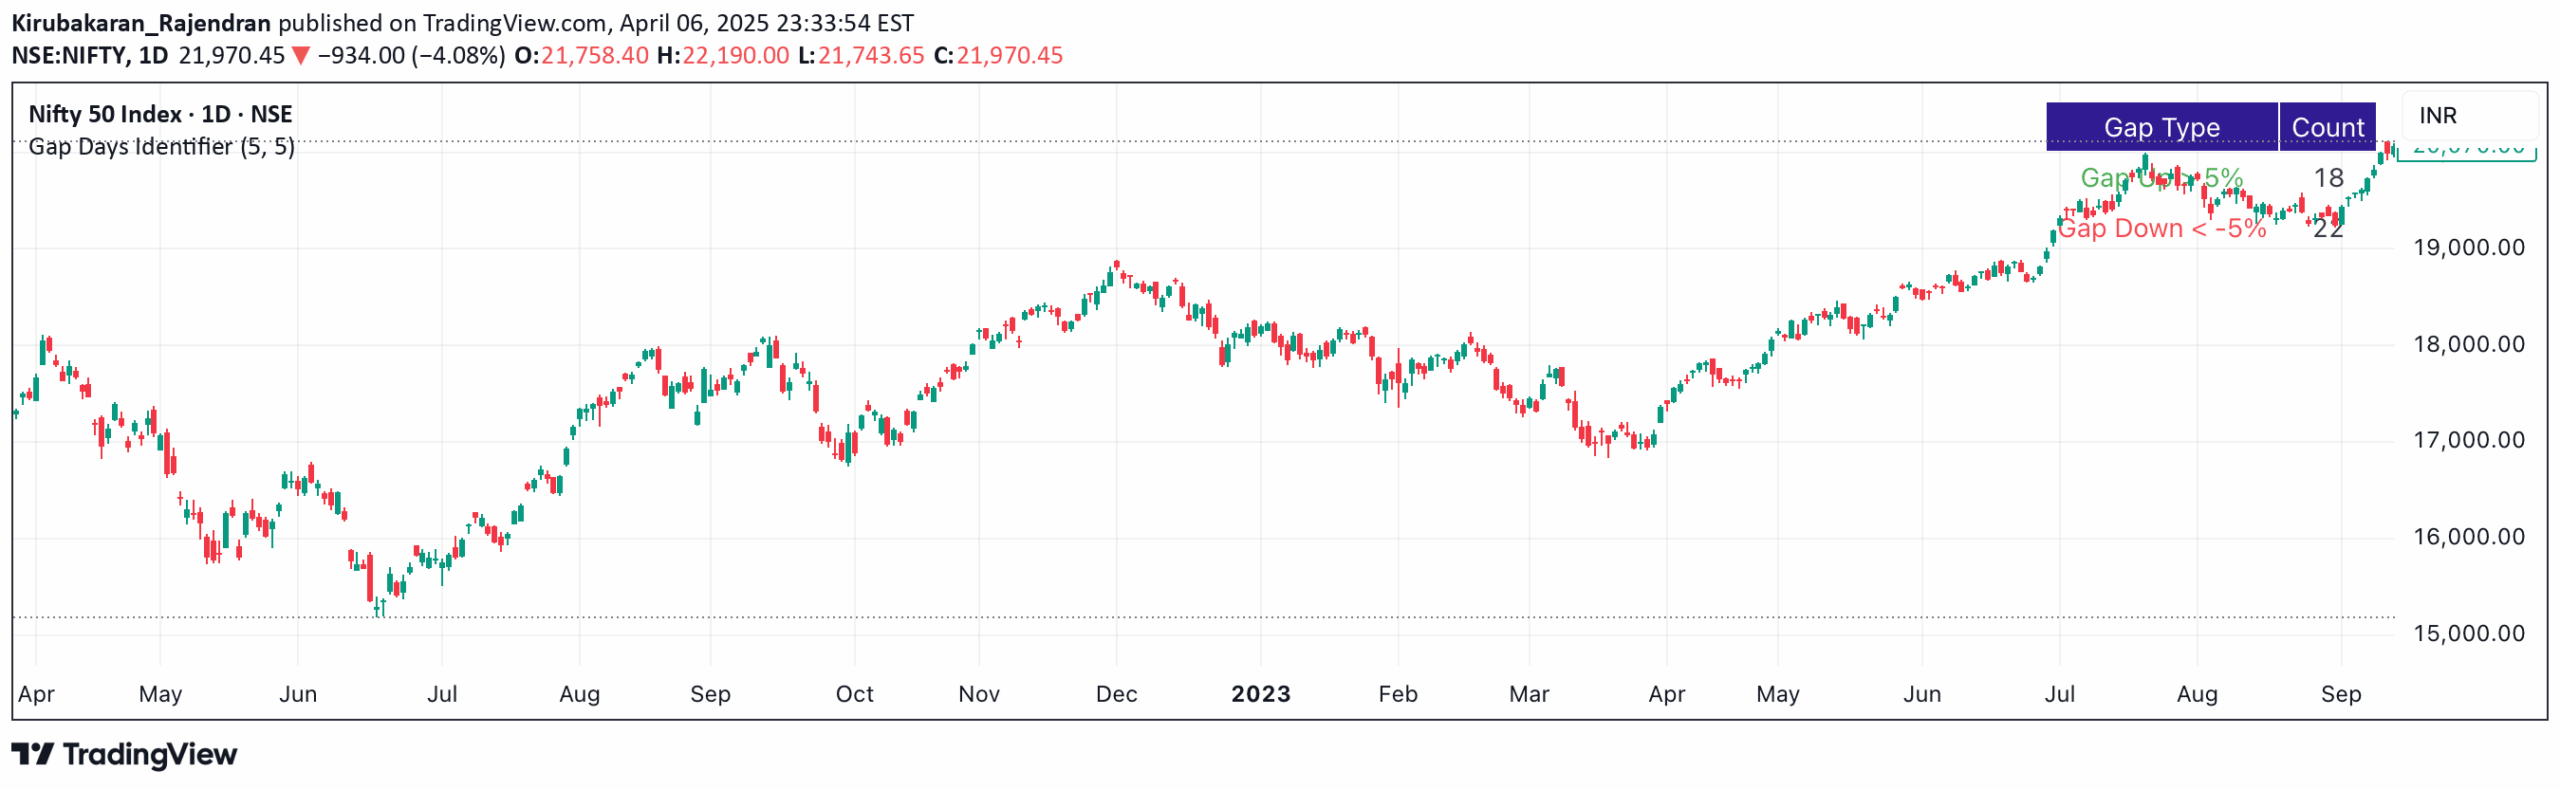
A Pine Script tool that identifies daily price gaps by calculating percentage differences between market open and previous day's close, helping traders spot significant overnight market movements.
Explore complementary indicator rolesHow it works
The script calculates the percentage difference between the current day's opening price and the previous day's closing price. It compares this gap against user-defined thresholds for Gap Up and Gap Down scenarios. When a gap exceeds the specified percentage, the script triggers visual markers on the chart.
These markers include colored arrows indicating the direction and magnitude of the price gap. The script tracks and accumulates statistics about gap occurrences, providing traders with a comprehensive overview of market gaps
Why it may be useful
Gap analysis is crucial for understanding market sentiment and potential price movements. By identifying significant overnight gaps, traders can gauge market psychology and potential trend reversals. These gaps often reflect important news events, earnings reports, or substantial market sentiment shifts.
The script's visual markers and statistical tracking help traders quickly interpret market dynamics. Understanding gap patterns can provide insights into potential support and resistance levels, entry and exit points, and overall market momentum
When to explore it
This indicator is most effective during volatile market conditions or when trading instruments prone to significant overnight movements. It works best for stocks, indices, and forex pairs with high liquidity and frequent news events.
Traders can use it to identify potential breakout opportunities, assess market sentiment, and manage risk. It is particularly useful during earnings seasons, economic announcements, and periods of geopolitical uncertainty. The tool helps traders make more informed decisions by providing a clear visualization of market gaps
Keep exploring
What we’ve verified
Access, alerts and repainting behaviour have not been independently verified for this indicator. Check the creator’s current publication and settings.
General descriptions and classifications are recovered research. Verified details above identify the specific checks we have completed. Check the creator’s current publication for later changes.