
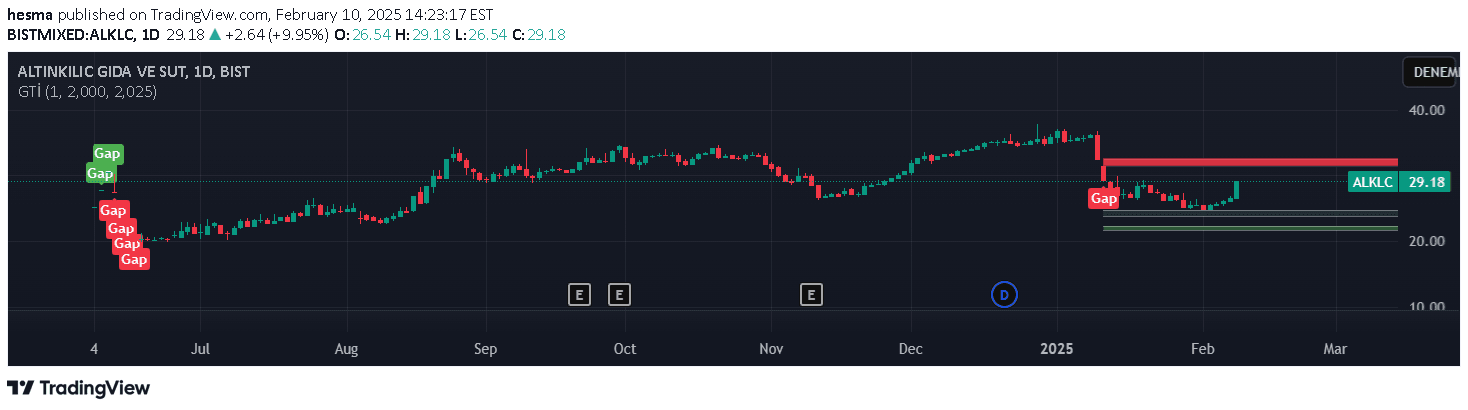
A gap detection indicator that identifies and visualizes price gaps, tracking their progression and coloring lines based on subsequent candle closures across specified date ranges.
Explore complementary indicator rolesHow it works
The gap detection indicator scans for price gaps exceeding a predefined percentage threshold, drawing lines connecting the start and end points of each identified gap. By tracking subsequent candle closures relative to the gap's starting level, the indicator dynamically changes line colors to provide visual feedback on gap progression.
When a candle closes above the gap's starting level, the lines are colored green, signaling potential bullish continuation. Conversely, if a candle closes below the gap's starting level, the lines turn red, indicating potential bearish sentiment or gap invalidation.
Why it may be useful
Gap analysis helps traders understand market dynamics and potential price momentum by highlighting significant price jumps that might signal important market sentiment shifts. By visualizing these gaps and their subsequent price action, traders can gain insights into potential trend reversals or continuation patterns.
The indicator's color-coding mechanism provides an intuitive way to quickly assess whether the market is maintaining the gap's initial momentum or potentially reversing, enabling traders to make more informed decisions about market direction and potential entry or exit points.
When to explore it
This gap detection indicator is most effective in volatile markets with significant price movements, particularly during earnings reports, economic announcements, or periods of high market uncertainty. Traders can use it to identify potential breakout opportunities and gauge market sentiment during rapid price changes.
The indicator works best on intraday and short-term timeframes, making it particularly useful for scalpers and day traders who seek to capitalize on quick price movements. By providing visual cues about gap progression and potential trend direction, the tool can help traders make more precise and timely trading decisions.
Keep exploring
What we’ve verified
Access, alerts and repainting behaviour have not been independently verified for this indicator. Check the creator’s current publication and settings.
General descriptions and classifications are recovered research. Verified details above identify the specific checks we have completed. Check the creator’s current publication for later changes.


