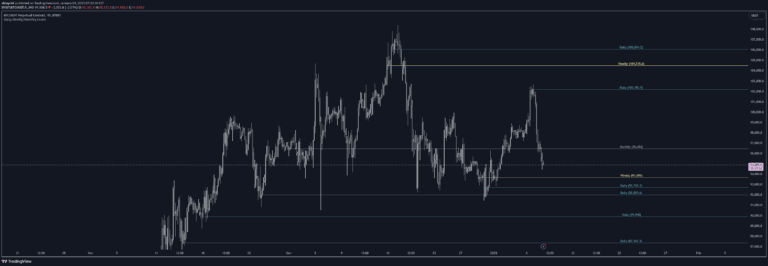
A bearish gap down indicator that identifies significant price drops by detecting when today's opening price falls below the previous day's low, signaling potential trend reversals or continuation.
Explore complementary indicator rolesHow it works
The indicator operates by analyzing the relationship between the current trading day's price action and the previous day's price levels. It specifically looks for a scenario where today's opening price is lower than the previous day's lowest price point, creating a confirmed gap down pattern.
When these precise conditions are met, the script automatically plots a red downward triangle above the corresponding price bar. This visual marker provides traders with an immediate and clear signal of a potential bearish price movement, highlighting significant downward price action without relying on additional technical indicators.
Why it may be useful
Gap down indicators are crucial for traders seeking to identify potential trend reversals or momentum shifts in the market. By pinpointing moments of significant price decline, traders can gain insights into market sentiment and potential selling pressure that might indicate broader market weakness.
The minimalist design of this indicator allows traders to focus on pure price action without the complexity of multiple overlapping technical signals. Its straightforward approach helps traders quickly recognize important price movements that could signal opportunities for short positions or risk management.
When to explore it
This indicator is most effective when applied to daily or higher timeframes, where price gaps carry more significant trading implications. Traders should use it in conjunction with other technical analysis tools to confirm potential trading signals and reduce false positives.
Ideal scenarios include periods of market uncertainty, during earnings seasons, or when analyzing stocks with high volatility. Combining this gap down indicator with volume analysis, support/resistance levels, or momentum indicators can provide a more comprehensive view of potential trading opportunities.
Keep exploring
What we’ve verified
Access, alerts and repainting behaviour have not been independently verified for this indicator. Check the creator’s current publication and settings.
General descriptions and classifications are recovered research. Verified details above identify the specific checks we have completed. Check the creator’s current publication for later changes.