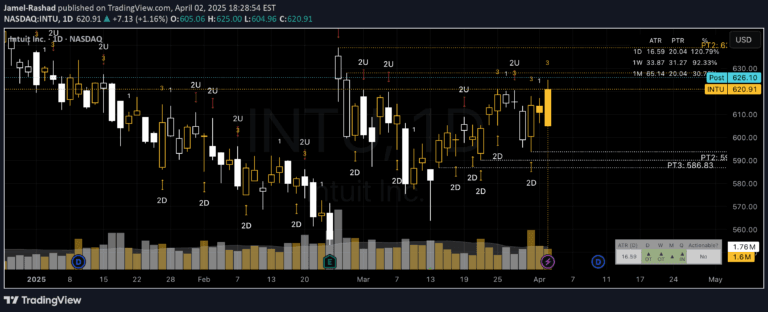
A trading signal that compares normal candlestick patterns with Heikin-Ashi to identify potential market reversals, gaps, and momentum shifts across different trading timeframes.
Explore complementary indicator rolesHow it works
The Gap & Reversal Signals method analyzes two different candlestick representations simultaneously: normal candlesticks and Heikin-Ashi candles. By comparing their characteristics, traders can identify specific market conditions like gap ups, gap downs, and potential trend reversals.
The signal generates different colored labels based on specific criteria: green for gap ups, red for gap downs, blue for bullish reversals, and orange for bearish reversals. These labels provide visual cues about potential market movements, helping traders quickly recognize trading opportunities across various timeframes.
Why it may be useful
This signal provides traders with a sophisticated method of identifying market momentum and potential trend changes by leveraging the unique properties of both normal and Heikin-Ashi candlesticks. By combining two different analytical approaches, traders can gain deeper insights into market dynamics that might be missed using traditional single-method analysis.
The multi-dimensional approach allows for more nuanced trading decisions, reducing the risk of false signals and providing a more comprehensive view of market behavior. Traders can use these signals to make more informed entry and exit decisions across different trading styles and timeframes.
When to explore it
The Gap & Reversal Signals are most effective in markets with clear trending characteristics and sufficient price volatility. They work best in liquid markets like major stock indices, forex pairs, and high-volume commodities where price movements are more predictable and consistent.
Traders should use these signals in conjunction with other technical indicators and fundamental analysis to confirm potential trading opportunities. They are particularly useful during periods of market transition, when trends are potentially changing or consolidating, offering traders a sophisticated tool for identifying early momentum shifts.
Keep exploring
What we’ve verified
Access, alerts and repainting behaviour have not been independently verified for this indicator. Check the creator’s current publication and settings.
General descriptions and classifications are recovered research. Verified details above identify the specific checks we have completed. Check the creator’s current publication for later changes.