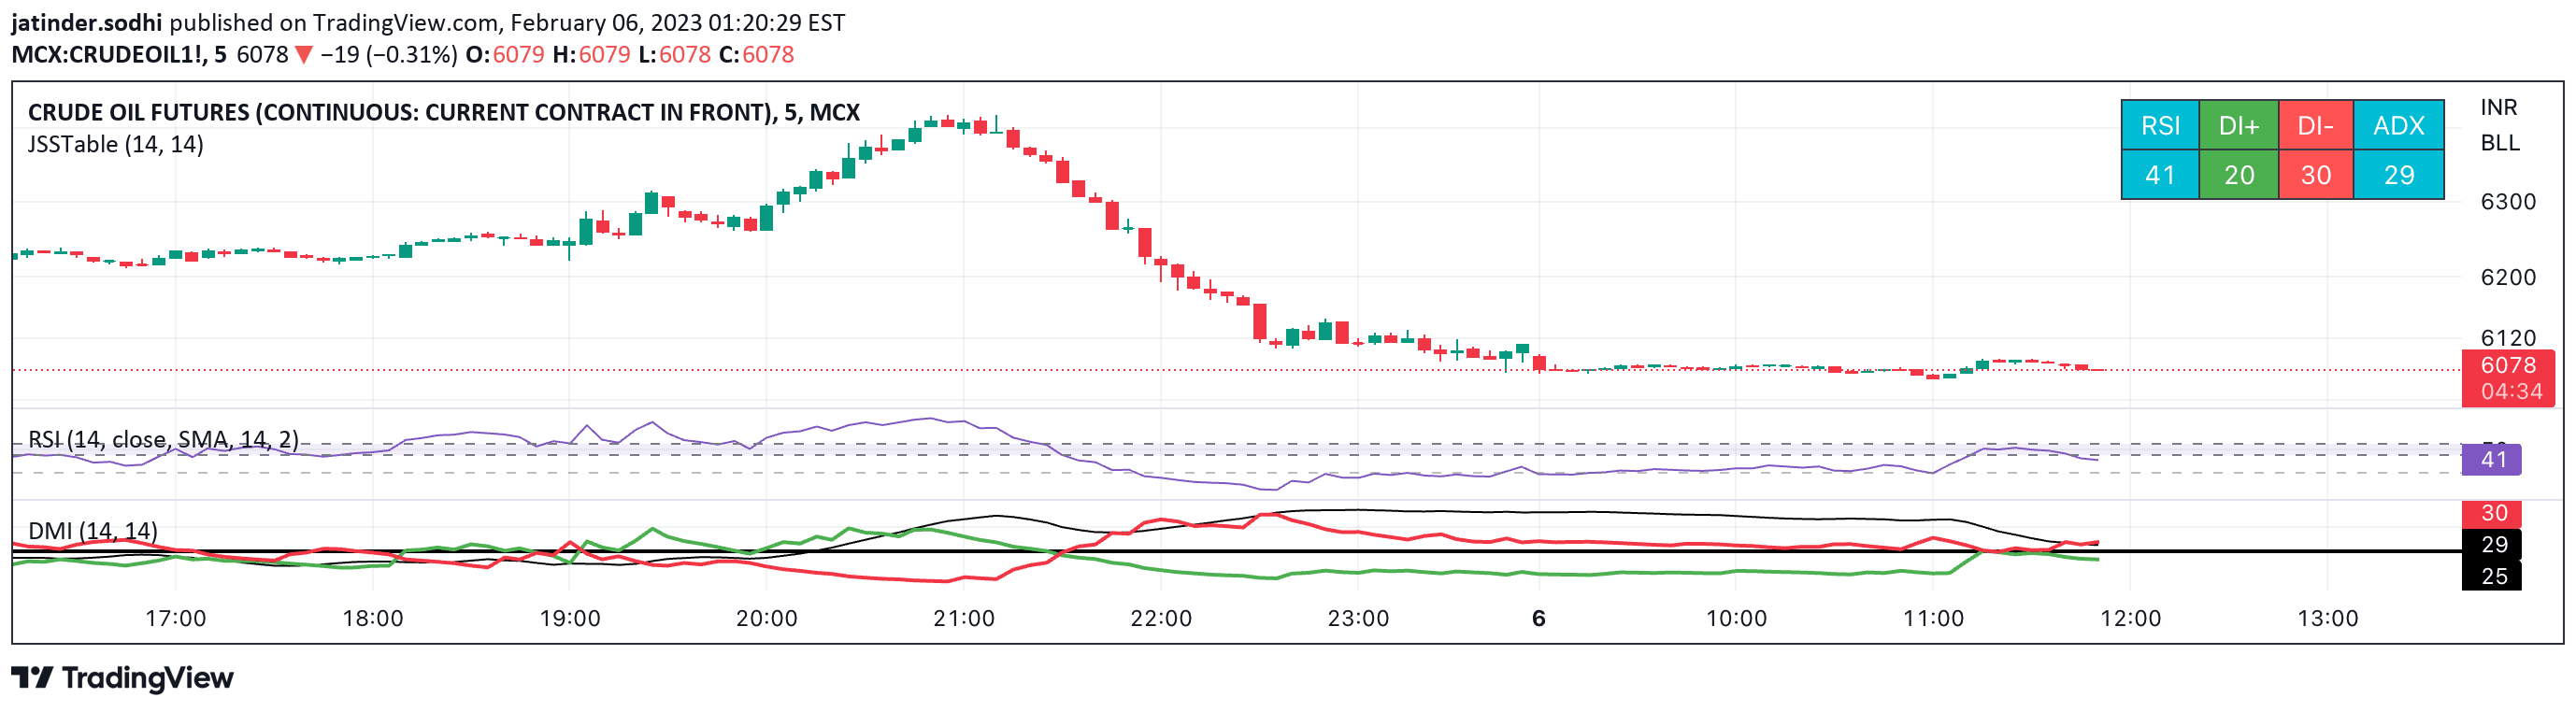
A sophisticated trading indicator combining Gaussian smoothing, RSI, and a loop-based scoring system to identify strong uptrends with enhanced momentum analysis and noise reduction.
Explore complementary indicator rolesHow it works
The Gaussian RSI For Loop indicator starts by applying a Gaussian Weighted Moving Average (GWMA) to price data, smoothing out market noise and emphasizing recent price movements. This smoothed data is then processed through an RSI calculation, which measures momentum by comparing upward and downward price changes.
The indicator then implements a loop-based scoring system that evaluates the Filtered RSI against predefined overbought and oversold thresholds. By systematically analyzing these values, the system generates a score that quantifies trend strength and direction, providing traders with clear signals about potential market movements.
Why it may be useful
Traditional trading indicators often struggle with market noise and false signals, making it challenging for traders to identify genuine trend opportunities. The Gaussian RSI For Loop addresses this by combining advanced smoothing techniques with momentum analysis, offering a more refined approach to trend identification.
By integrating Gaussian filtering, RSI, and a sophisticated scoring mechanism, the indicator provides traders with a comprehensive tool that reduces market noise, enhances signal accuracy, and offers deeper insights into price momentum. This multi-layered approach helps traders make more informed decisions by filtering out minor fluctuations and focusing on significant trend movements.
When to explore it
The Gaussian RSI For Loop is most effective in markets with clear trending characteristics, particularly during periods of sustained upward or downward movement. It performs exceptionally well in markets that experience moderate volatility, where price trends are more defined and less erratic.
Traders should consider using this indicator during trending market conditions, such as during strong bull or bear markets, or when trading assets with consistent directional movements. It is particularly useful for identifying potential entry and exit points in stocks, cryptocurrencies, and forex markets where momentum plays a crucial role in price action.
Keep exploring
What we’ve verified
Access, alerts and repainting behaviour have not been independently verified for this indicator. Check the creator’s current publication and settings.
General descriptions and classifications are recovered research. Verified details above identify the specific checks we have completed. Check the creator’s current publication for later changes.