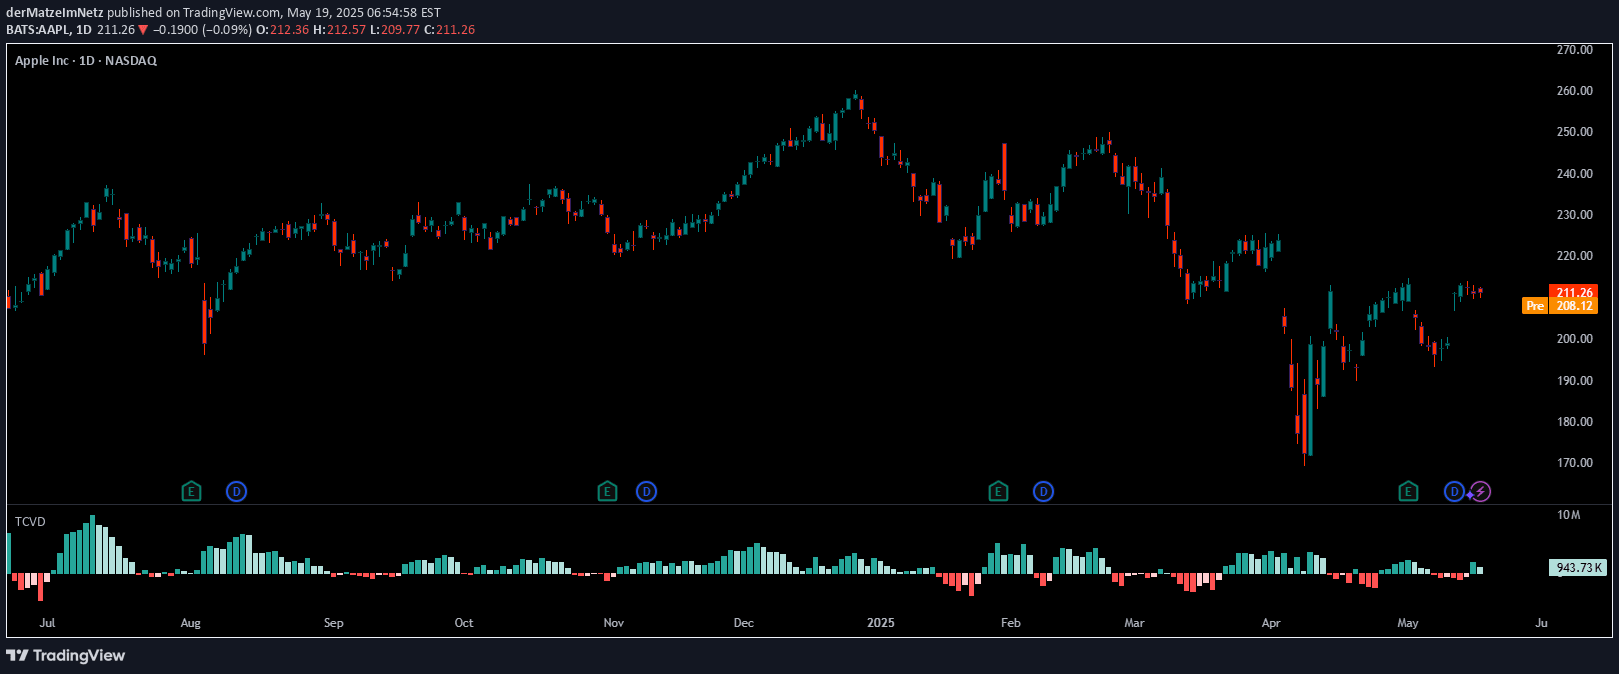
Normalized Volume (NV) is an innovative tool that scales volume data from 0-100, providing a standardized way to assess trading volume across different market sessions and timeframes.
Explore complementary indicator rolesHow it works
The Normalized Volume (NV) transforms raw volume data into a percentage scale from 0 to 100, where 0 represents the lowest volume and 100 represents the highest volume observed on the chart. It analyzes volume relative to the specific timeframe and market session, allowing traders to compare volume levels more effectively.
By breaking down the day into four distinct sessions, the tool provides contextual volume analysis that helps traders understand volume significance across different market periods. The indicator uses color-coding and customizable visual elements to highlight volume intensity, making it easier to interpret volume patterns and potential market movements.
Why it may be useful
Volume is a critical indicator of market momentum and potential price movements, but raw volume numbers can be difficult to interpret. The Normalized Volume solves this problem by providing a standardized, easy-to-understand representation of trading volume that allows traders to quickly assess market activity and strength.
By scaling volume to a 0-100 range, traders can more accurately gauge the significance of price moves and volume spikes. This approach helps identify potential trend confirmations, market sentiment shifts, and areas of significant trading interest that might not be apparent from standard volume displays.
When to explore it
The Normalized Volume is most effective during active trading sessions with significant market activity, particularly in liquid markets with consistent volume data. It works best when traders want to compare volume levels across different time periods and market sessions, providing insights into potential trend strength and market dynamics.
Traders should pay special attention to NV values above 40, which indicate high volume and potential trading opportunities. The tool is particularly useful for day traders and scalpers who need quick, reliable volume assessment to make rapid trading decisions.
Keep exploring
What we’ve verified
Access, alerts and repainting behaviour have not been independently verified for this indicator. Check the creator’s current publication and settings.
General descriptions and classifications are recovered research. Verified details above identify the specific checks we have completed. Check the creator’s current publication for later changes.