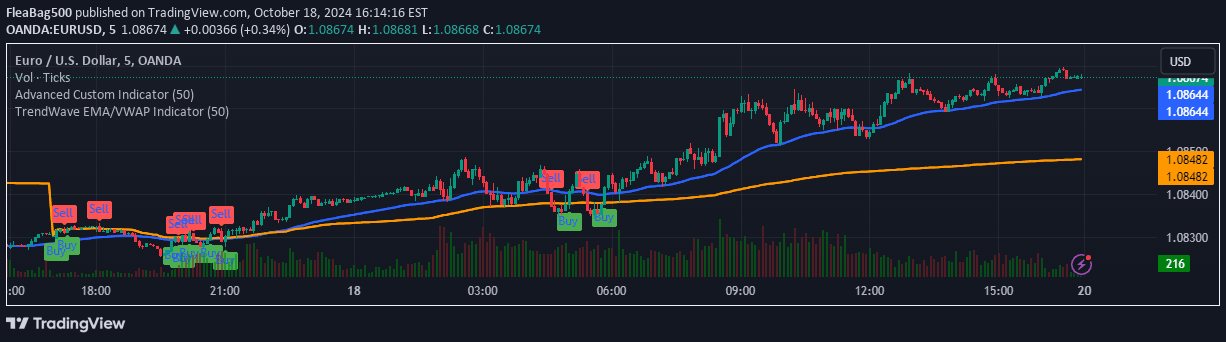
A geometric mean indicator that calculates the balance point between two moving averages, revealing market equilibrium and potential trend shifts through dynamic crossover signals.
Explore complementary indicator rolesHow it works
The Geometric Mean Indicator operates by calculating the geometric mean between two moving averages of different lengths, creating a dynamic equilibrium line. It first computes moving averages using specified time periods, then mathematically determines their geometric mean by taking the square root of their product.
The resulting geometric mean line serves as a central reference point for price action, dynamically adjusting based on the selected moving average lengths. The indicator plots these moving averages and the geometric mean line, providing a visual representation of market balance and potential transition points.
Why it may be useful
The Geometric Mean Indicator offers traders a unique perspective on market dynamics by identifying balanced price levels and potential trend transition zones. By mathematically linking two moving averages, it provides insights into market equilibrium that traditional indicators might miss, helping traders understand underlying price movements.
This approach transforms a complex geometric concept into a practical trading tool, enabling traders to detect potential trend reversals and significant price action moments. The indicator's ability to highlight balance points makes it valuable for understanding market psychology and identifying potential entry or exit opportunities.
When to explore it
The Geometric Mean Indicator works best in markets with clear trending characteristics and moderate volatility, where price movements between two moving averages reveal meaningful market dynamics. Traders should consider using this indicator when seeking to identify potential trend reversals or balance points in price action.
It is particularly effective when combined with other technical analysis tools, such as support and resistance levels or momentum indicators. Optimal usage includes adjusting the moving average lengths to match specific trading timeframes and market conditions, allowing for a more refined and personalized trading approach.
Keep exploring
What we’ve verified
Access, alerts and repainting behaviour have not been independently verified for this indicator. Check the creator’s current publication and settings.
General descriptions and classifications are recovered research. Verified details above identify the specific checks we have completed. Check the creator’s current publication for later changes.