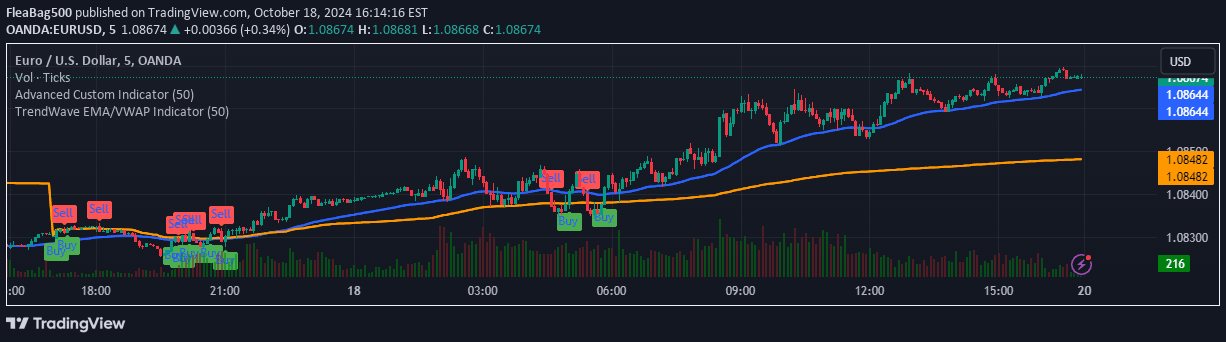
A custom technical analysis tool combining three Simple Moving Averages and one Exponential Moving Average to create a dynamic trend-following indicator for identifying market direction and potential trade signals.
Explore complementary indicator rolesHow it works
The Weighted Moving Average Indicator (WMAI) calculates a composite line by integrating three Simple Moving Averages and one Exponential Moving Average. This blended approach allows the indicator to capture both short-term and long-term price movements with enhanced sensitivity to recent price changes.
By combining different moving average types, the WMAI creates a more nuanced representation of price trends compared to traditional single moving average indicators. The resulting line provides traders with a dynamic view of market momentum, smoothing out price fluctuations and offering a clearer perspective on underlying market trends.
Why it may be useful
The WMAI provides traders with a comprehensive tool for understanding market dynamics by offering a multi-dimensional view of price movements. Its unique combination of moving averages helps traders identify trend direction, potential support and resistance levels, and possible entry and exit points with greater precision than standard single moving average indicators.
By integrating different moving average calculations, the WMAI reduces the impact of short-term price noise while maintaining responsiveness to meaningful market shifts. This approach enhances traders' ability to make informed decisions by providing a more robust and nuanced interpretation of market trends.
When to explore it
The WMAI is most effective in markets with clear trending characteristics, where price movements show consistent directional momentum. Traders can leverage this indicator in both bullish and bearish market conditions, using it to confirm trend strength and potential reversal points across various financial instruments and timeframes.
Optimal usage occurs when the WMAI is combined with other technical analysis tools like momentum oscillators or volume indicators. By cross-referencing signals and looking for confluence, traders can increase the reliability of their trading decisions and reduce the likelihood of false signals.
Keep exploring
What we’ve verified
Access, alerts and repainting behaviour have not been independently verified for this indicator. Check the creator’s current publication and settings.
General descriptions and classifications are recovered research. Verified details above identify the specific checks we have completed. Check the creator’s current publication for later changes.