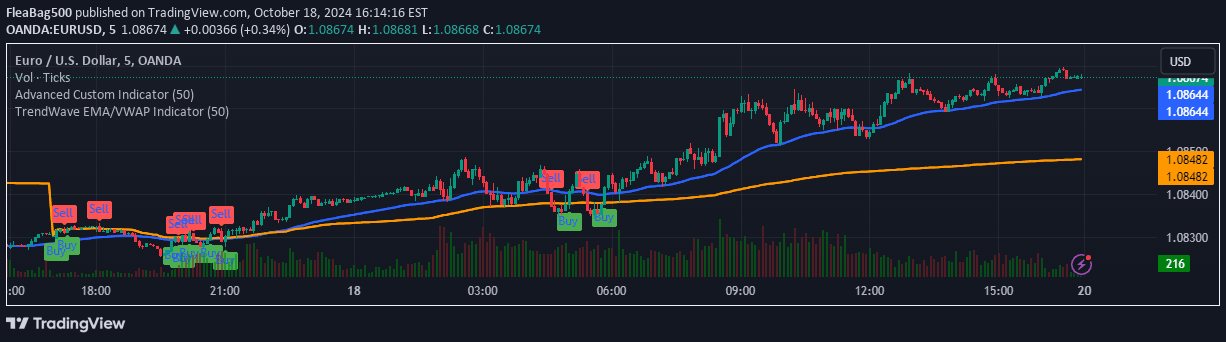
The VWAP ROC Weighted Average indicator combines Volume Weighted Average Price and Rate of Change to create a unique trading tool for identifying market trends, support/resistance levels, and potential entry points.
Explore complementary indicator rolesHow it works
The VWAP ROC Weighted Average calculates the average Volume Weighted Average Price (VWAP) and average Rate of Change (ROC) over a specified period, typically 200 bars. It then creates a weighted average of these two values, generating a single line that represents market momentum and price dynamics.
This line provides traders with a comprehensive view of price movement by integrating volume-weighted pricing and rate of change. The indicator smooths out price fluctuations and considers trading volume, offering a more nuanced perspective on market trends compared to traditional price-only indicators.
Why it may be useful
The VWAP ROC Weighted Average offers traders a sophisticated tool for understanding market dynamics by combining multiple analytical perspectives. It provides insights into price momentum, volume influence, and potential trend directions, which can help traders make more informed trading decisions.
By integrating volume and price change metrics, this indicator helps traders identify potential market reversals, confirm trend strength, and recognize critical support and resistance levels. Its versatility makes it valuable across different trading styles and market conditions, offering a comprehensive view of market behavior.
When to explore it
The VWAP ROC Weighted Average works best in markets with clear trending characteristics and sufficient trading volume. It is particularly effective in liquid markets like major stock indices, forex pairs, and heavily traded commodities where volume data provides meaningful insights.
Traders should utilize this indicator during periods of established market trends, when looking to confirm trend strength, identify potential entry and exit points, and assess momentum shifts. It is especially useful when combined with other technical analysis tools to validate trading signals and reduce false positive interpretations.
Keep exploring
What we’ve verified
Access, alerts and repainting behaviour have not been independently verified for this indicator. Check the creator’s current publication and settings.
General descriptions and classifications are recovered research. Verified details above identify the specific checks we have completed. Check the creator’s current publication for later changes.