
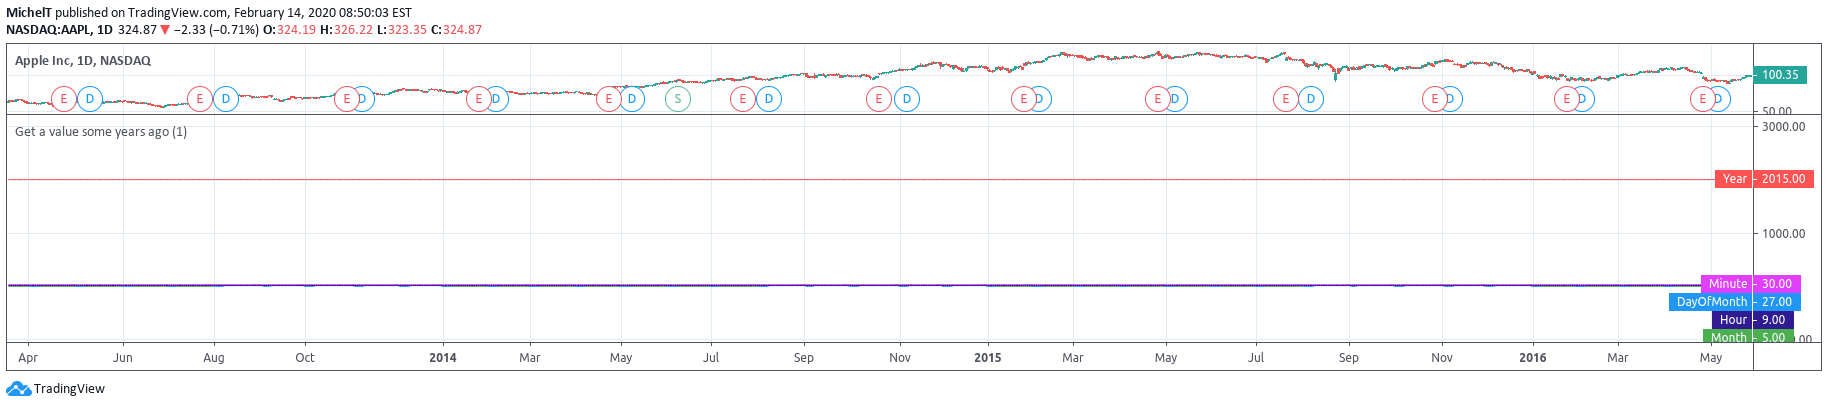
A script technique for retrieving historical bar values from a previous year, enabling traders to compare current price action with past performance and extract comparative market insights.
Explore complementary indicator rolesHow it works
This script allows traders to access bar values from previous years by utilizing Pine Script's historical data retrieval functions. By specifying a specific year or timeframe, the script can extract price, volume, or other bar-related data for comparative analysis.
The technique involves using functions like security() or historical referencing methods to pull specific bar information from past periods. Traders can define exact parameters for year and data type they want to examine. The script provides flexibility in selecting which historical data points to retrieve and analyze. This method enables precise historical data exploration beyond standard chart views
Why it may be useful
Historical data retrieval is crucial for understanding long-term market trends and patterns. By accessing past year's bar values, traders can identify cyclical market behaviors and potential recurring price movements. This technique allows for deeper historical context and comparative analysis across different market periods.
Traders can validate current trading strategies by examining similar historical scenarios. The ability to extract specific historical data points provides enhanced analytical capabilities beyond traditional charting methods. Such insights can help improve trading decision-making and strategy development. Historical data comparison is a powerful tool for understanding market dynamics
When to explore it
This script technique is most effective when analyzing long-term market trends and seeking comparative insights across different years. Traders can utilize this method during periods of market uncertainty or when establishing historical context for current price action. It works best for strategies involving multi-year trend analysis, seasonal pattern recognition, and comparative market studies.
Ideal for swing traders and investors looking to understand broader market cycles. Particularly useful when examining specific market sectors or assets with predictable annual patterns. Traders can leverage this technique to validate trading hypotheses and develop more robust investment strategies
Keep exploring
What we’ve verified
Access, alerts and repainting behaviour have not been independently verified for this indicator. Check the creator’s current publication and settings.
General descriptions and classifications are recovered research. Verified details above identify the specific checks we have completed. Check the creator’s current publication for later changes.


