Pivot Point Supertrend
Pivot Point SuperTrend is an advanced trend-following indicator that combines pivot points with SuperTrend to generate more reliable trading signals and identify potential trend reversals.
Explore 11,183 indicators. Filter beyond the obvious.
Discover the tools that fit the way you trade.
11,183 tools to explore
Pivot Point SuperTrend is an advanced trend-following indicator that combines pivot points with SuperTrend to generate more reliable trading signals and identify potential trend reversals.
Ichimoku Kinko Hyo is a comprehensive technical indicator that provides insights into trend direction, momentum, and potential support and resistance levels using multiple components.
Order Blocks & Breaker Blocks indicator identifies key price zones where significant trading activity occurred, highlighting potential future trading opportunities based on market structure.
A trading indicator that develops higher timeframe bias by analyzing previous day/week high and low price levels, providing a strategic approach to anticipating potential price movements.
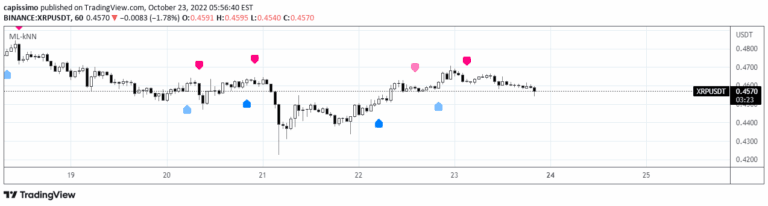
A k-Nearest Neighbours machine learning strategy that predicts market moves by analyzing historic data and finding similar past market conditions to forecast future price directions.
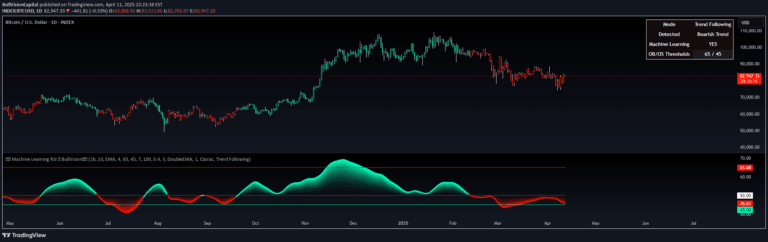
A sophisticated RSI indicator that uses machine learning and K-Nearest Neighbors to dynamically adapt momentum analysis by comparing current market conditions with historical patterns.
A tool that identifies potential price reversal zones using statistical probability by analyzing historical swing points and calculating precise percentile-based predictions.
A technical analysis tool that identifies dynamic support and resistance levels by connecting past pivot high and low points, which can be applied to various indicators and chart types.
The RS Rating evaluates a stock's price performance relative to the market over 52 weeks, helping traders identify stocks that are outperforming and potentially poised for further gains.
A price projection tool that forecasts future market behavior by analyzing historical price patterns and applying a user-defined growth factor to simulate potential price movements.
The Bollinger Band Width Percentile measures relative volatility by calculating the percentage of historical periods where Bollinger Band width was narrower than the current period.
A parametric moving average with adjustable lag and overshoot, providing customizable trend analysis and potential reversal points using a modified sinewave kernel.
Likes, views, and comments are historical TradingView snapshots. They describe attention, not trading performance.