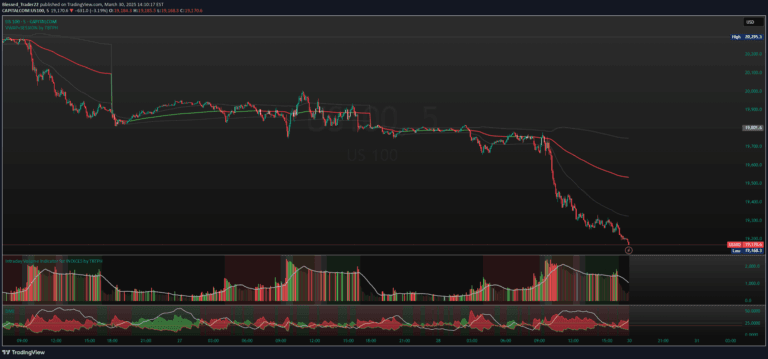
The ACD Method is a trading strategy that uses key price points and market sessions to identify optimal entry and exit points across various financial markets.
Explore complementary indicator rolesHow it works
The ACD Method focuses on analyzing the opening range of trades using critical reference points A and C to generate buy and sell signals. Traders identify key price levels by monitoring these points throughout the trading session, using them as entry and exit markers for potential trades.
The strategy relies on evaluating daily and multi-day pivot ranges to understand market trends. By examining price movements in relation to these pivot points, traders can determine market direction, with prices above pivots indicating an upward trend and prices below signaling a downward trend.
Why it may be useful
The ACD Method provides traders with a structured approach to market analysis, offering clear guidelines for identifying potential trading opportunities. By establishing precise entry and exit points, the strategy helps traders minimize emotional decision-making and create a more systematic trading approach.
This method is particularly valuable because it can be applied across multiple markets, including stocks, commodities, and forex. Its versatility, combined with the ability to generate specific buy and sell signals, makes it an essential tool for traders seeking to improve their market timing and risk management strategies.
When to explore it
The ACD Method is most effective during volatile or strongly trending markets, particularly in instruments like crude oil and stocks. It works best during specific trading sessions with high liquidity, such as the Asian, London, and New York market sessions, where significant price movements and trading volumes occur.
Traders should implement this strategy during kill zones - specific time periods characterized by higher trading volumes and increased price volatility. The method is especially useful when combined with technical indicators that can confirm trend strength and provide additional validation for potential trade entries and exits.
Keep exploring
What we’ve verified
Access, alerts and repainting behaviour have not been independently verified for this indicator. Check the creator’s current publication and settings.
General descriptions and classifications are recovered research. Verified details above identify the specific checks we have completed. Check the creator’s current publication for later changes.