A trading indicator that highlights the previous week's high price on a chart, providing traders with a key reference point for potential support and resistance levels.
Explore complementary indicator rolesHow it works
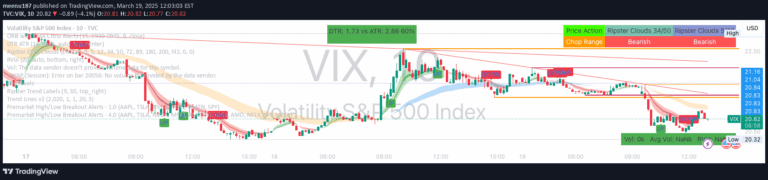
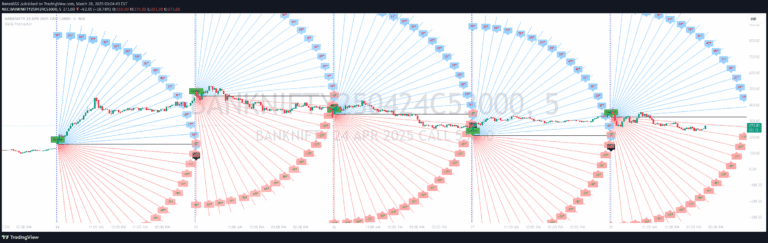
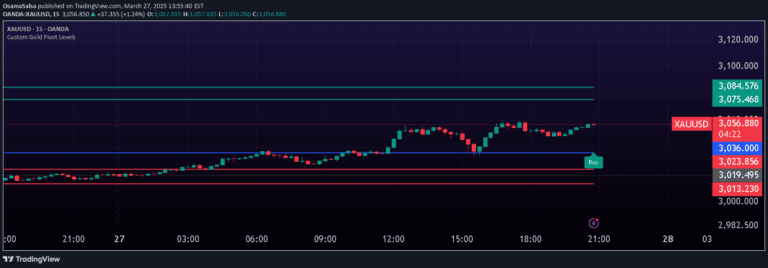
The GL_Prev Week High Indicator automatically calculates and plots the highest price point from the previous week directly on the trading chart. It creates a distinct red line representing this high point, allowing traders to visually track critical price levels across different timeframes.
The indicator also generates a dynamic white horizontal line that can be customized in length, width, and color to suit individual trading preferences. Additionally, it tracks and labels the all-time high from the chart's historical data, providing traders with comprehensive price level information in real-time.
Why it may be useful
Identifying key price levels is crucial for making informed trading decisions, and the GL_Prev Week High Indicator simplifies this process by automatically highlighting important reference points. By showing the previous week's high, traders can quickly assess potential resistance levels, trend strength, and market sentiment without manual calculations.
The indicator's real-time updates and customizable features make it a valuable tool for traders across different strategies and timeframes. Its ability to track both weekly highs and all-time highs provides traders with a comprehensive view of price dynamics, helping them make more strategic entry and exit decisions.
When to explore it
The GL_Prev Week High Indicator is most effective during trending markets where understanding previous price levels can provide insights into potential future price movements. Traders can use this tool to identify potential resistance zones, confirm trend strength, and plan strategic entry and exit points based on historical price performance.
It is particularly useful for traders who focus on technical analysis and want a quick, visual representation of key price levels. The indicator can be especially valuable during periods of market volatility, helping traders navigate complex price action by providing clear, objective reference points derived from recent market history.
Keep exploring
What we’ve verified
Access, alerts and repainting behaviour have not been independently verified for this indicator. Check the creator’s current publication and settings.
General descriptions and classifications are recovered research. Verified details above identify the specific checks we have completed. Check the creator’s current publication for later changes.