
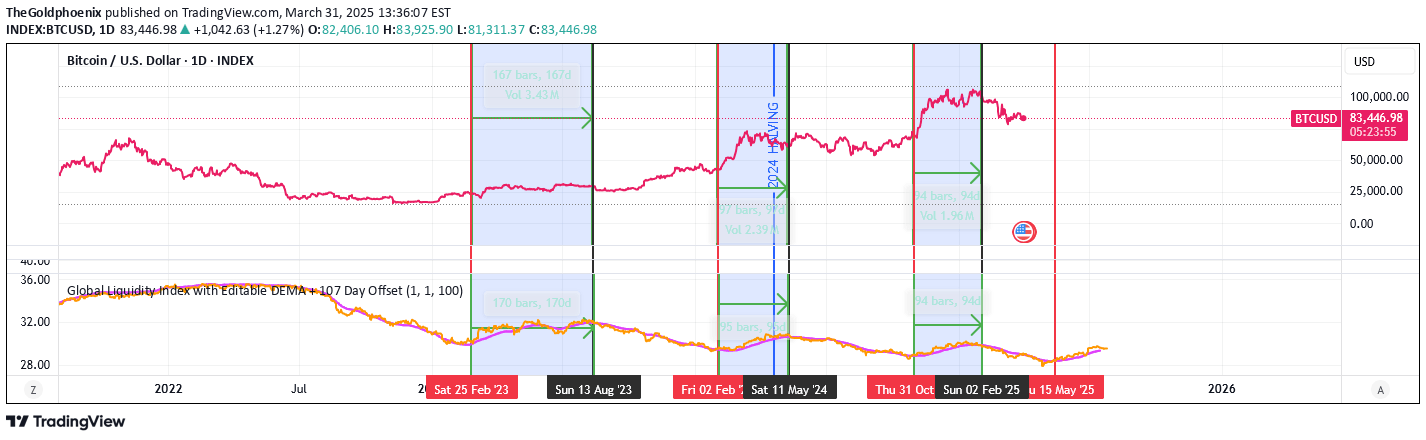
A global liquidity indicator using Double Exponential Moving Average to smooth central bank balance sheets and money supply with a 107-day forward projection for macro market analysis.
Explore complementary indicator rolesHow it works
The Global Liquidity DEMA calculates a Double Exponential Moving Average of combined central bank balance sheets and money supply data. It applies a smoothing technique to reduce noise and highlight underlying trends. The indicator then shifts the smoothed data forward by 107 days, creating a predictive view of potential market movements.
This forward projection helps traders anticipate market reactions to liquidity changes. The script also includes a Rate of Change (ROC) Simple Moving Average to provide additional momentum insights. By smoothing and offsetting the data, the indicator creates a more nuanced perspective on global economic liquidity trends
Why it may be useful
This indicator is crucial for understanding macro-level market dynamics by tracking global central bank liquidity. It provides traders with a forward-looking view of potential market shifts based on monetary policy changes. By highlighting the delayed market reaction to liquidity trends, traders can make more informed long-term investment decisions.
The indicator helps connect broader economic indicators with market performance. It offers a unique perspective on how central bank actions might influence future market movements. Traders can use this tool to anticipate potential trend changes and adjust their strategies accordingly
When to explore it
The Global Liquidity DEMA works best for long-term macro analysis across various markets like stocks, cryptocurrencies, and commodities. It is most effective when examining broader economic trends and potential market turning points. Traders should use this indicator during periods of significant monetary policy changes or economic transitions.
It is particularly useful for swing traders and investors looking to understand long-term market cycles. The 107-day lead provides insights into potential future market movements based on liquidity trends. Ideal for analyzing markets with complex macro-economic influences
Keep exploring
What we’ve verified
Access, alerts and repainting behaviour have not been independently verified for this indicator. Check the creator’s current publication and settings.
General descriptions and classifications are recovered research. Verified details above identify the specific checks we have completed. Check the creator’s current publication for later changes.


