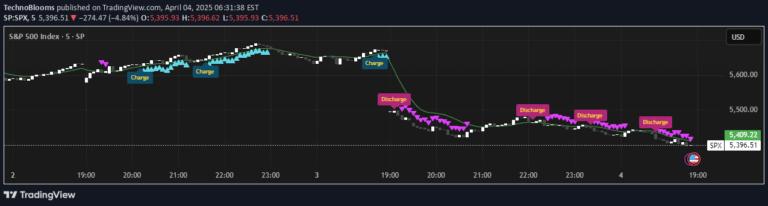
A dynamic trading signal combining Fibonacci retracement levels with a gradient-colored filter to identify potential trend continuations and support/resistance zones.
Explore complementary indicator rolesHow it works
The signal first calculates key Fibonacci retracement levels using the highest high and lowest low within a specified lookback period. These levels are generated at 0.0, 0.236, 0.382, 0.5, 0.618, and 1.0 percentages, creating potential support and resistance zones for price action. The dynamic gradient filter simultaneously computes a smoothed line that changes color based on its RSI value, providing additional trend insight.
As the filtered line moves, its color transitions from red to green, indicating changing momentum and trend strength. The Fibonacci levels are plotted as horizontal dotted lines extending back through the lookback period, allowing traders to visually identify potential reversal or continuation zones where price might interact with these critical levels.
Why it may be useful
Fibonacci retracement levels are powerful tools for identifying potential market turning points, as they represent key psychological price levels where traders frequently expect price reversals or consolidations. By combining these levels with a dynamic gradient filter, traders gain a multi-dimensional view of market behavior, allowing for more nuanced decision-making about potential entry and exit points.
The color-changing filter provides real-time momentum insights, helping traders understand the underlying strength of a trend. This integrated approach allows for a more comprehensive market analysis, reducing the likelihood of making trades based on incomplete information and providing a more holistic view of price action and potential market movements.
When to explore it
This signal is most effective in markets with clear trending characteristics, where price frequently respects Fibonacci retracement levels. It works particularly well in forex, stock, and cryptocurrency markets that exhibit consistent directional movements and periodic retracements. Traders should look for situations where the filtered line's color changes coincide with interactions between price and Fibonacci levels.
The signal is especially useful during periods of market volatility, where quick identification of potential support and resistance zones can provide critical trading insights. Traders should combine this signal with other technical indicators and fundamental analysis to confirm potential trade setups and minimize false signals.
Keep exploring
What we’ve verified
Access, alerts and repainting behaviour have not been independently verified for this indicator. Check the creator’s current publication and settings.
General descriptions and classifications are recovered research. Verified details above identify the specific checks we have completed. Check the creator’s current publication for later changes.