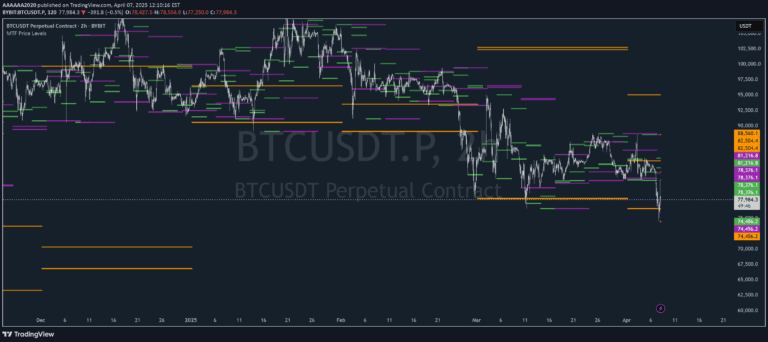
Liquidity Pivot Cloud extends pivot levels to create a dynamic liquidity map, revealing key areas where price historically reacts and institutional activity may occur.
Explore complementary indicator rolesHow it works
The Liquidity Pivot Cloud (LPC) operates by automatically extending all pivot highs and lows across the chart, transforming traditional static pivot points into a continuous, dynamic liquidity zone. By stretching these pivot levels, the indicator creates a visual cloud that highlights areas where price has repeatedly interacted or changed direction.
This visualization allows traders to see overlapping pivot regions that represent potential liquidity pools. The extended cloud helps identify complex price action structures, showing how different pivot points interconnect and create meaningful trading zones beyond simple horizontal support and resistance levels.
Why it may be useful
The Liquidity Pivot Cloud provides traders with a sophisticated method of understanding market dynamics and potential institutional activity. By revealing hidden liquidity zones, traders can anticipate potential price reactions, stop hunts, and areas of significant market interest that might not be apparent through traditional technical analysis.
This approach aligns with smart money concepts, offering insights into where significant market participants might be positioning themselves. The tool helps traders move beyond simple price action and understand the underlying liquidity landscape, potentially improving trade entry, exit, and overall strategic decision-making.
When to explore it
The Liquidity Pivot Cloud is most effective in markets with clear institutional participation and consistent price action patterns. It works best in liquid markets like forex, futures, and major stock indices where volume and institutional trading are significant factors driving price movement.
Traders should use LPC in conjunction with other confirmation tools like Fair Value Gaps, Market Structure shifts, and Institutional Price Blocks. It is particularly valuable during ranging and trending markets, helping identify potential reversal zones, consolidation areas, and key liquidity levels that might trigger significant price movements.
Keep exploring
What we’ve verified
Access, alerts and repainting behaviour have not been independently verified for this indicator. Check the creator’s current publication and settings.
General descriptions and classifications are recovered research. Verified details above identify the specific checks we have completed. Check the creator’s current publication for later changes.