
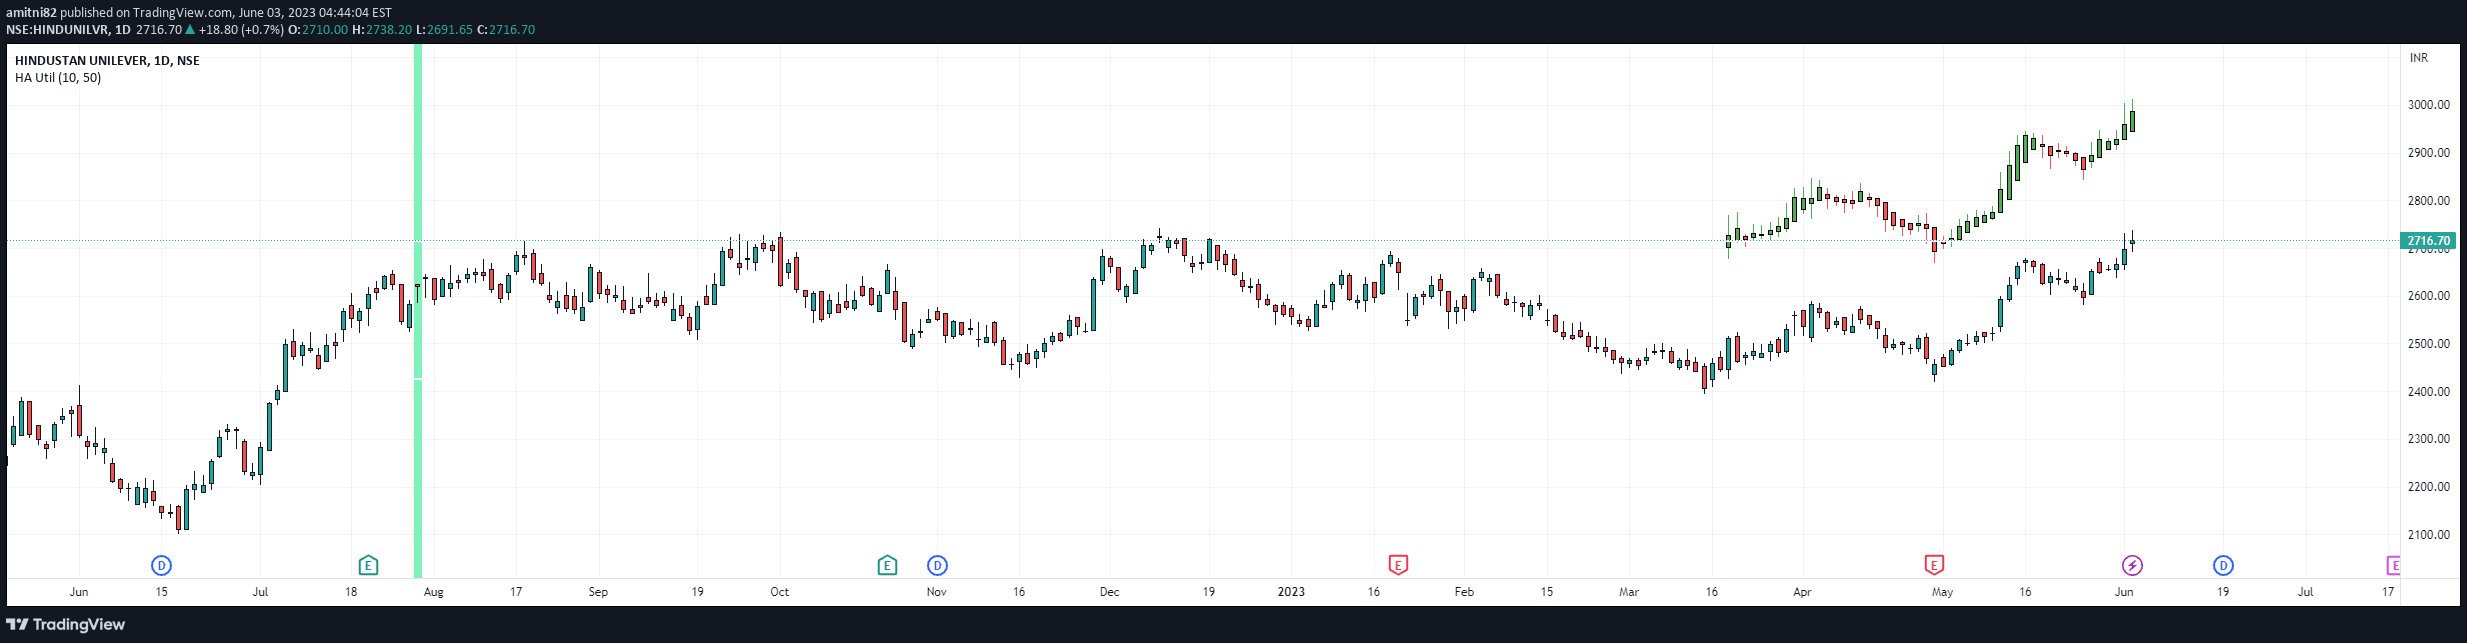
A custom indicator that displays Heikin Ashi candles on the chart and highlights trend reversals between red and green candles for improved trade momentum visualization.
Explore complementary indicator rolesHow it works
The indicator first generates Heikin Ashi candles based on a configurable percentage placement on the chart, providing a smoothed representation of price action. These modified candles help traders identify trend momentum by averaging price data and creating a more visually intuitive candle representation.
Additionally, the indicator tracks color transitions between candles, generating a green line when a solid red candle transforms into a solid green candle, and a red line when a solid green candle changes to a solid red candle. These visual signals help traders quickly recognize potential trend reversals and momentum shifts.
Why it may be useful
Heikin Ashi candles offer a unique perspective on market trends by smoothing price action and reducing market noise, making it easier for traders to identify underlying momentum. By modifying traditional candlestick representations, traders can more clearly distinguish between bullish and bearish market conditions.
The color transition lines provide immediate visual cues about trend changes, allowing traders to make faster and more informed decisions. These signals can help traders enter or exit positions more strategically, potentially improving overall trading performance and reducing emotional decision-making.
When to explore it
This indicator is most effective in markets with clear trending characteristics, such as stocks, forex, or cryptocurrency markets that demonstrate consistent directional movements. Traders can benefit from using this tool in both volatile and stable market conditions to gain insights into potential trend reversals.
The indicator is particularly useful for momentum traders who seek to capitalize on sustained price movements and want a clear, visual representation of market sentiment. It can be applied across multiple timeframes, making it versatile for scalpers, day traders, and swing traders looking to enhance their technical analysis.
Keep exploring
What we’ve verified
Access, alerts and repainting behaviour have not been independently verified for this indicator. Check the creator’s current publication and settings.
General descriptions and classifications are recovered research. Verified details above identify the specific checks we have completed. Check the creator’s current publication for later changes.


