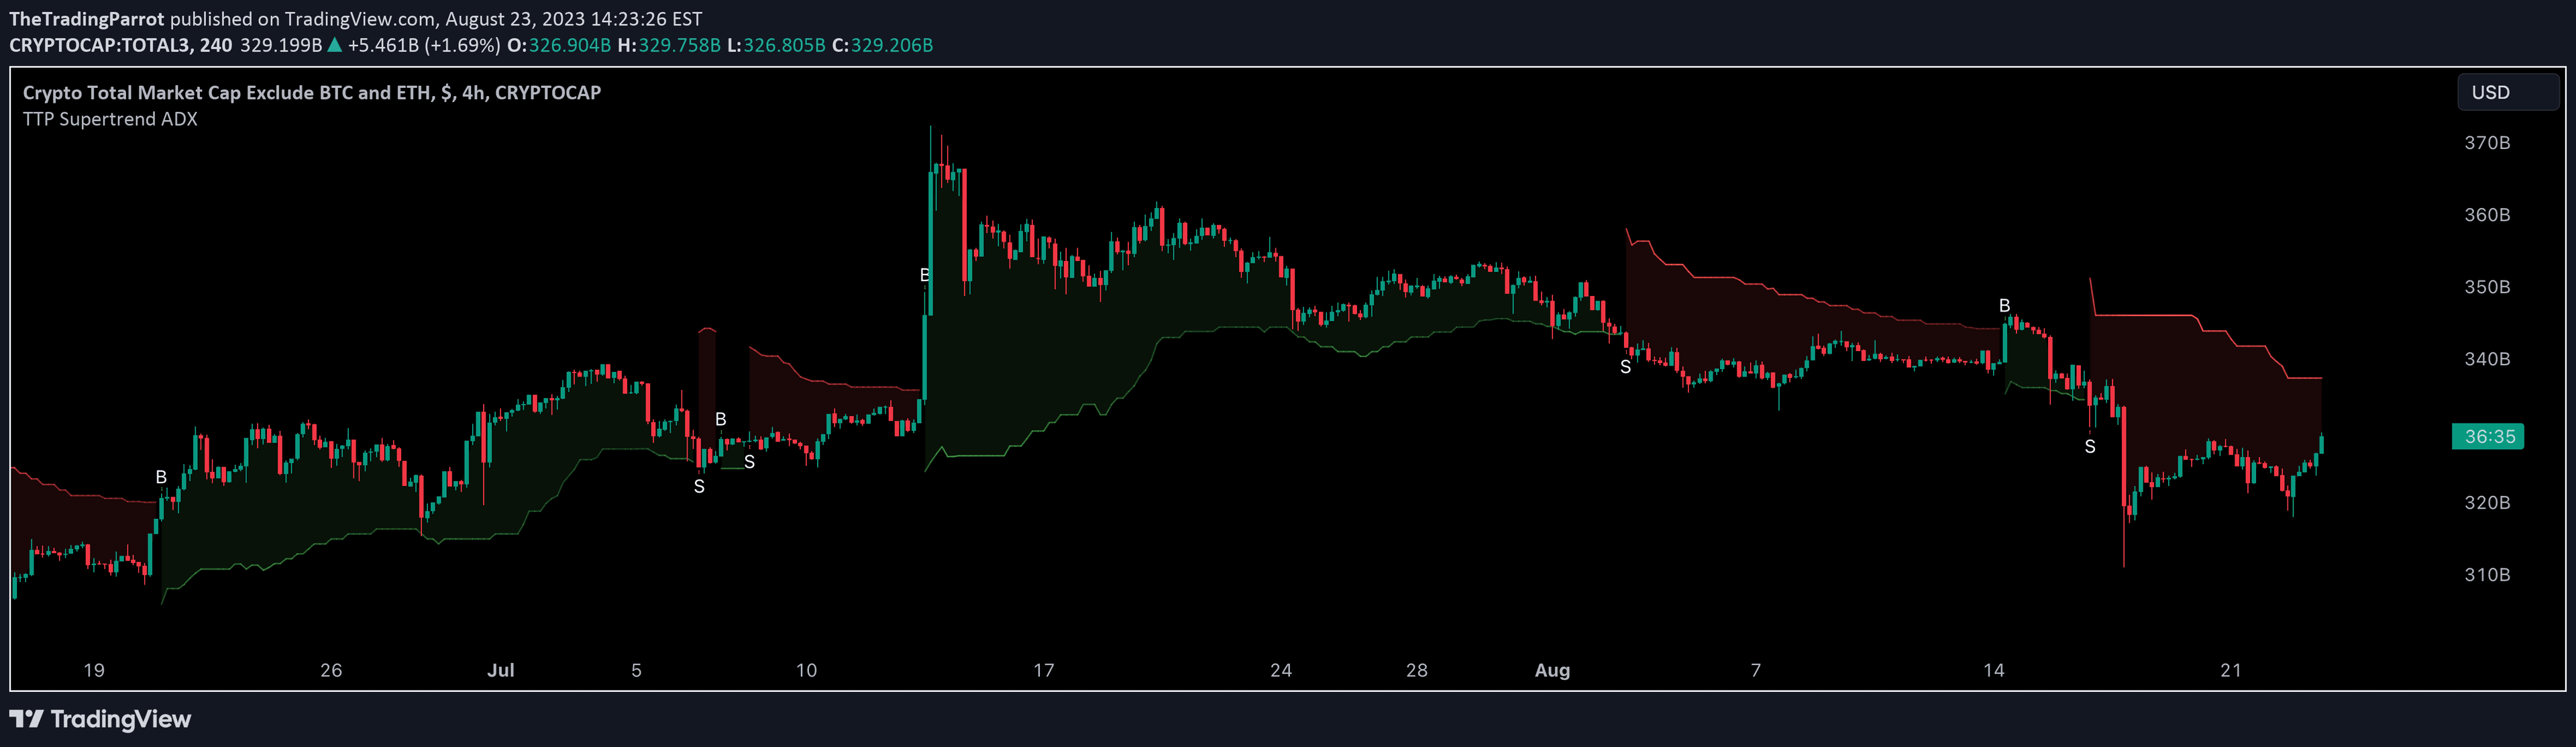
A dynamic Supertrend indicator that introduces a mid-level line to enhance trend analysis by providing deeper insights into trend strength and potential entry points.
Explore complementary indicator rolesHow it works
The Half Supertrend [NLR] indicator builds upon the standard Supertrend calculation by incorporating a unique mid-level line derived from half the Average True Range (ATR). It calculates this mid-level by adding or subtracting half of the ATR-based trailing stop value from the main Supertrend line, creating an intermediary zone for trend assessment.
The indicator uses configurable parameters like ATR length and factor to dynamically adjust the mid-level line. By analyzing the price's position relative to both the Supertrend line and this mid-level, traders can gain a more nuanced understanding of trend strength, potential consolidation zones, and early reversal signals.
Why it may be useful
Traditional trend indicators often generate false signals and lack clarity about trend conviction, making it challenging for traders to make confident decisions. The Half Supertrend [NLR] addresses these limitations by providing a sophisticated method to evaluate trend strength through its innovative mid-level line, which offers a more granular view of market dynamics.
By filtering out market noise and offering a visual representation of trend intensity, this indicator helps traders distinguish between strong trending moves and potential consolidation periods. The color-coded lines and dynamic entry levels simplify trend analysis, enabling traders to make more informed and strategic trading decisions across various market conditions.
When to explore it
The Half Supertrend [NLR] is most effective in markets with clear directional movements and moderate volatility, where trend identification and confirmation are crucial. It performs exceptionally well in liquid markets like forex, stock indices, and major cryptocurrency pairs, where price tends to exhibit more predictable trending behavior.
Traders should utilize this indicator when seeking to validate trend strength, identify optimal entry points during pullbacks, and detect early potential trend reversals. It is particularly valuable for traders who want a more nuanced approach to trend analysis that goes beyond traditional Supertrend indicators, providing deeper insights into market momentum and directional moves.
Keep exploring
What we’ve verified
Access, alerts and repainting behaviour have not been independently verified for this indicator. Check the creator’s current publication and settings.
General descriptions and classifications are recovered research. Verified details above identify the specific checks we have completed. Check the creator’s current publication for later changes.