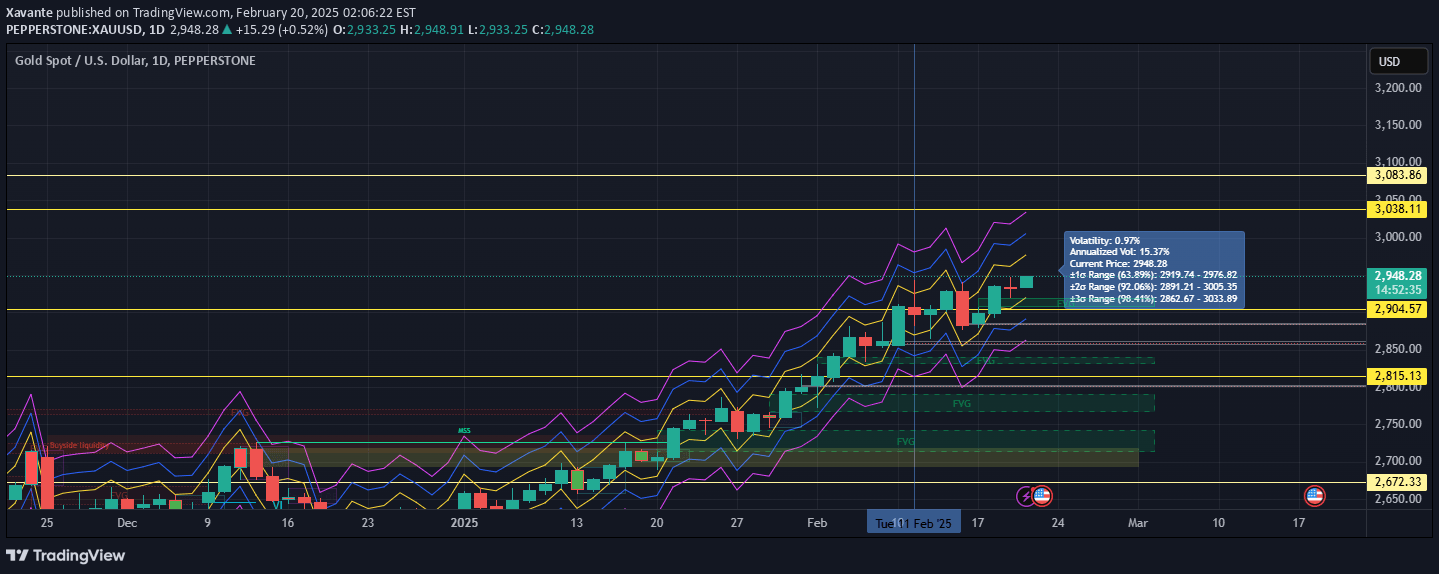
The True Strength Index (TSI) is a momentum indicator that helps traders identify trend direction, strength, and potential reversals by smoothing price momentum calculations.
Explore complementary indicator rolesHow it works
The True Strength Index calculates momentum through a sophisticated double smoothing process of price movements. It first computes single smoothed momentum by subtracting smoothed closing prices, then applies an additional smoothing layer to create a refined momentum measurement.
The indicator then generates a ratio between the double smoothed momentum and absolute smoothed momentum, multiplying the result by 100 to create a percentage-based oscillator. This oscillator fluctuates around a zero centerline, with positive values indicating bullish momentum and negative values signaling bearish momentum.
Why it may be useful
The TSI provides traders with a nuanced view of market momentum that goes beyond simple price movement analysis. By using double smoothing techniques, it reduces market noise and offers a more refined perspective on trend strength and potential reversals.
Traders can leverage the TSI to confirm trend directions, identify potential entry and exit points, and assess the underlying market sentiment. Its ability to smooth out price fluctuations makes it particularly valuable for understanding complex market dynamics and making more informed trading decisions.
When to explore it
The TSI works best in trending markets where clear momentum shifts can be identified and leveraged. It is especially effective when used in conjunction with other technical analysis tools to confirm signals and reduce the likelihood of false entries.
Traders should consider using the TSI during periods of sustained price movement, such as during strong bull or bear markets. It is particularly useful for identifying potential trend reversals, momentum divergences, and assessing the overall strength of a current market trend across various financial instruments and timeframes.
Keep exploring
What we’ve verified
Access, alerts and repainting behaviour have not been independently verified for this indicator. Check the creator’s current publication and settings.
General descriptions and classifications are recovered research. Verified details above identify the specific checks we have completed. Check the creator’s current publication for later changes.