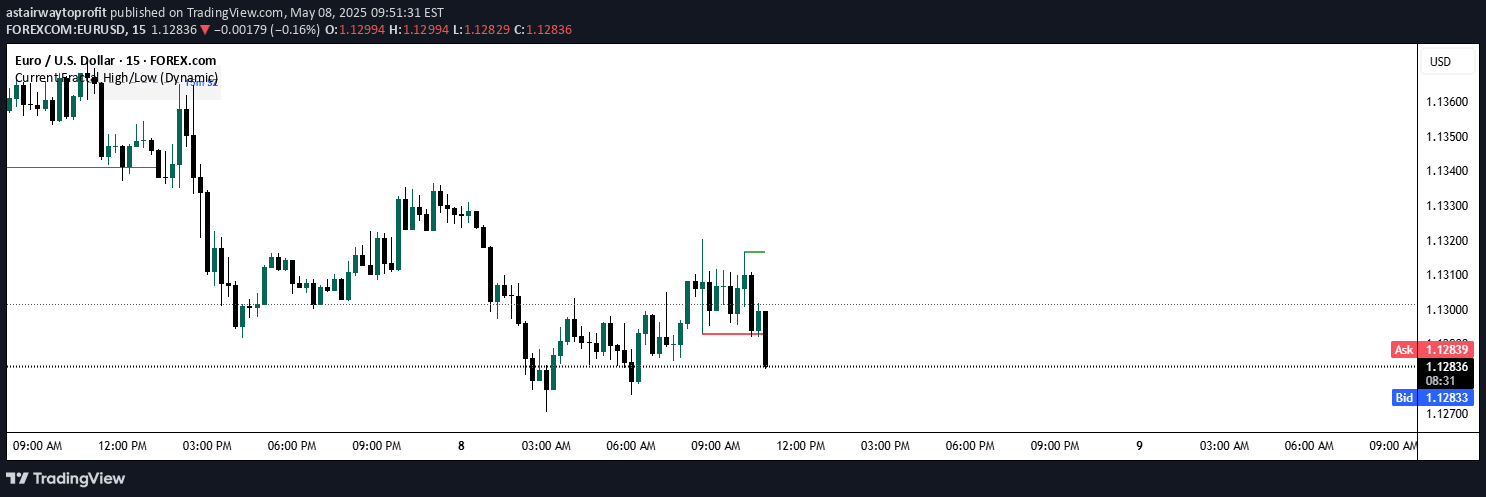
A trading tool for identifying high and low price points within a specific time period, enabling traders to visualize and analyze price movements across multiple days.
Explore complementary indicator rolesHow it works
The indicator allows traders to select a specific start and end time to analyze price movements across multiple trading days. By defining a precise time window, the tool draws lines and marks timestamps where the highest and lowest prices occurred during that specific period.
Users can input the exact hour and minute for their desired time range, enabling a customized analysis of price action. The tool then generates visual representations of price extremes, helping traders identify potential patterns and trading opportunities within their selected timeframe.
Why it may be useful
This indicator provides traders with a targeted method for analyzing price behavior during specific time periods, which can reveal consistent market patterns and potential trading opportunities. By highlighting high and low points across multiple days, traders can gain insights into market dynamics and potential entry or exit points.
The tool is particularly valuable for traders studying specific market methodologies like ICT Macros or 6VS10, offering a structured approach to understanding price movement within predefined time windows. Its visual representation makes complex price data more accessible and interpretable.
When to explore it
This indicator is most effective when traders want to analyze consistent price behaviors during specific time periods across multiple trading days. It is particularly useful for identifying recurring market patterns and potential trading opportunities within a defined timeframe.
Traders can leverage this tool when studying specific market methodologies, comparing price actions, or looking for consistent high and low points that might indicate potential trading strategies. It is especially beneficial for those interested in intraday and short-term trading approaches.
Keep exploring
What we’ve verified
Access, alerts and repainting behaviour have not been independently verified for this indicator. Check the creator’s current publication and settings.
General descriptions and classifications are recovered research. Verified details above identify the specific checks we have completed. Check the creator’s current publication for later changes.