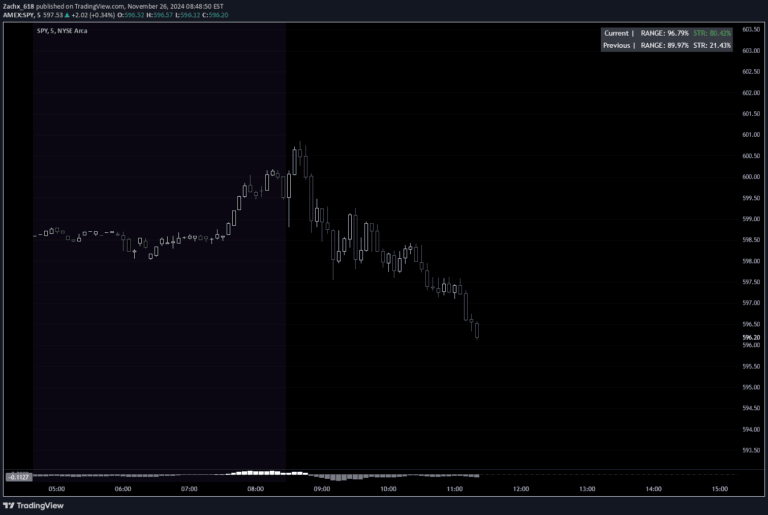
A Pine Script indicator that identifies high volatility and significant price changes by analyzing Average True Range and percentage price movements to detect potential trading opportunities.
Explore complementary indicator rolesHow it works
The indicator first calculates the Average True Range (ATR) to measure market volatility by tracking price range and gaps between consecutive bars. It simultaneously computes the percentage price change over a specified lookback period, comparing current price to historical values.
When both conditions are simultaneously met - high volatility exceeding a predefined ATR threshold and significant price movement beyond a set percentage - the script generates a signal. This signal is visually plotted beneath the corresponding price bar, providing traders with a clear visual representation of potential trading opportunities.
Why it may be useful
Volatility and price movement analysis are critical for traders seeking to identify dynamic market conditions and potential entry or exit points. By combining ATR measurements with percentage price changes, traders can detect moments of significant market activity that might indicate emerging trends or potential reversals.
This approach helps traders filter out mundane market movements and focus on periods of meaningful price action. The script's ability to generate clear, objective signals reduces emotional decision-making and provides a systematic method for identifying potentially lucrative trading opportunities.
When to explore it
This indicator works best in markets experiencing substantial price fluctuations, such as during earnings announcements, economic releases, or periods of heightened market uncertainty. It is particularly effective for traders who thrive on capturing quick, significant price movements across various financial instruments.
Traders should combine this signal with additional technical and fundamental analysis to validate potential trades. The indicator is most reliable in liquid markets with consistent trading volume, where price movements are more likely to represent genuine market sentiment rather than random noise.
Keep exploring
What we’ve verified
Access, alerts and repainting behaviour have not been independently verified for this indicator. Check the creator’s current publication and settings.
General descriptions and classifications are recovered research. Verified details above identify the specific checks we have completed. Check the creator’s current publication for later changes.