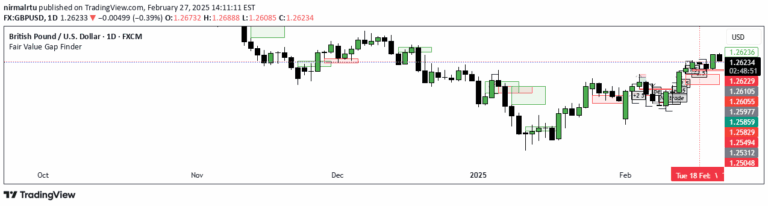
A candlestick analysis tool that calculates volatility and strength percentages for the current and previous candlesticks, providing quick insights into price action dynamics.
Explore complementary indicator rolesHow it works
The indicator calculates two primary metrics for each candlestick: volatility and strength. Volatility is determined by dividing the candlestick's price range (high minus low) by the Average True Range (ATR), which provides a normalized measure of price fluctuation. Strength is calculated by comparing the candlestick's body range to its total price range, expressed as a percentage that indicates how decisively the price moved in a particular direction.
The calculations are displayed in the top right corner of the chart, showing percentages for both the current and previous candlesticks. Green coloration indicates when these metrics exceed a predetermined threshold, helping traders quickly assess the price action's significance without manual calculations.
Why it may be useful
This indicator simplifies complex price action analysis by automating calculations that traders would traditionally perform manually. By providing instant insights into candlestick volatility and strength, it helps traders quickly evaluate market dynamics and potential entry points. The visual representation allows for rapid assessment of price movement intensity and directional conviction.
The tool is particularly valuable for traders who rely on price action strategies, as it transforms subjective visual analysis into quantifiable metrics. By reducing the cognitive load of manual calculations, traders can make faster, more informed decisions about potential trade entries and market conditions.
When to explore it
The indicator is most effective for traders focusing on short-term price movements and seeking quick insights into candlestick dynamics. It works best in markets with clear price action and during periods of active trading, such as during market opens or around significant economic events. Scalpers and day traders will find particular value in its real-time analysis of price volatility and strength.
Traders should use this tool in conjunction with other technical analysis methods, treating it as a supplementary filter for trade entries rather than a standalone signal. It is most reliable in liquid markets with consistent price movements, such as major forex pairs, stock indices, and highly traded commodities.
Keep exploring
What we’ve verified
Access, alerts and repainting behaviour have not been independently verified for this indicator. Check the creator’s current publication and settings.
General descriptions and classifications are recovered research. Verified details above identify the specific checks we have completed. Check the creator’s current publication for later changes.