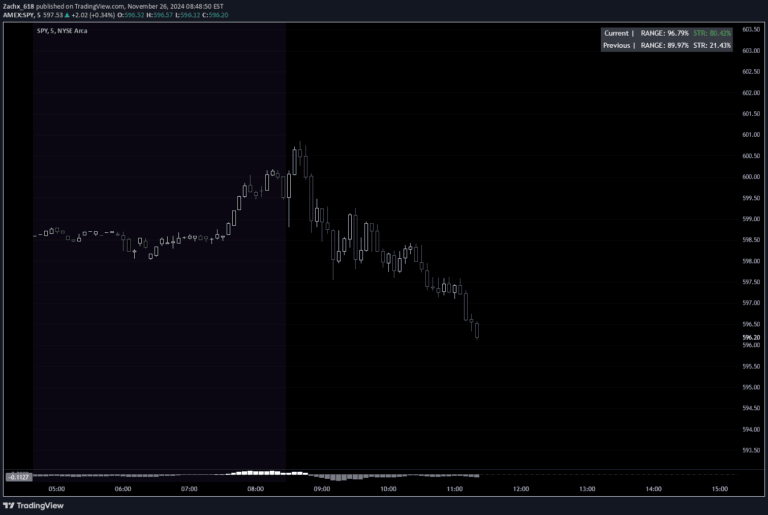
The Wick Strength indicator measures relative candlestick wick strength to reveal potential market dynamics and sentiment shifts by analyzing upper and lower price movements.
Explore complementary indicator rolesHow it works
The Wick Strength indicator calculates the strength of candlestick wicks by comparing upward and downward movements within each candle's range. It generates a dynamic line plot that represents evolving wick strength across different timeframes, providing a unique perspective on price action dynamics.
By analyzing the relative lengths and proportions of upper and lower wicks, the indicator creates a continuous score that indicates potential market sentiment and pressure. The calculation is not range-bound, allowing for comprehensive comparison of wick strengths across various market conditions and timeframes.
Why it may be useful
The Wick Strength indicator offers traders an innovative method to understand subtle market dynamics beyond traditional price movement analysis. By revealing potential imbalances between buying and selling pressures, it provides insights into hidden market sentiment and potential trend reversals that might not be immediately apparent.
This unique approach allows traders to complement existing technical analysis tools by offering an additional layer of market interpretation. The indicator can help identify potential divergences between price action and underlying market dynamics, potentially revealing early signs of changing market conditions.
When to explore it
The Wick Strength indicator is most effective during periods of market uncertainty and potential trend transitions, where traditional price action might not reveal complete market sentiment. It performs exceptionally well in volatile markets where price movements are complex and multidirectional, providing traders with nuanced insights into potential trend reversals.
Traders should consider using this indicator in conjunction with other technical analysis tools to validate signals and develop more comprehensive trading strategies. It is particularly useful when seeking to understand the subtle psychological aspects of market movements and identifying potential shifts in market momentum.
Keep exploring
What we’ve verified
Access, alerts and repainting behaviour have not been independently verified for this indicator. Check the creator’s current publication and settings.
General descriptions and classifications are recovered research. Verified details above identify the specific checks we have completed. Check the creator’s current publication for later changes.