
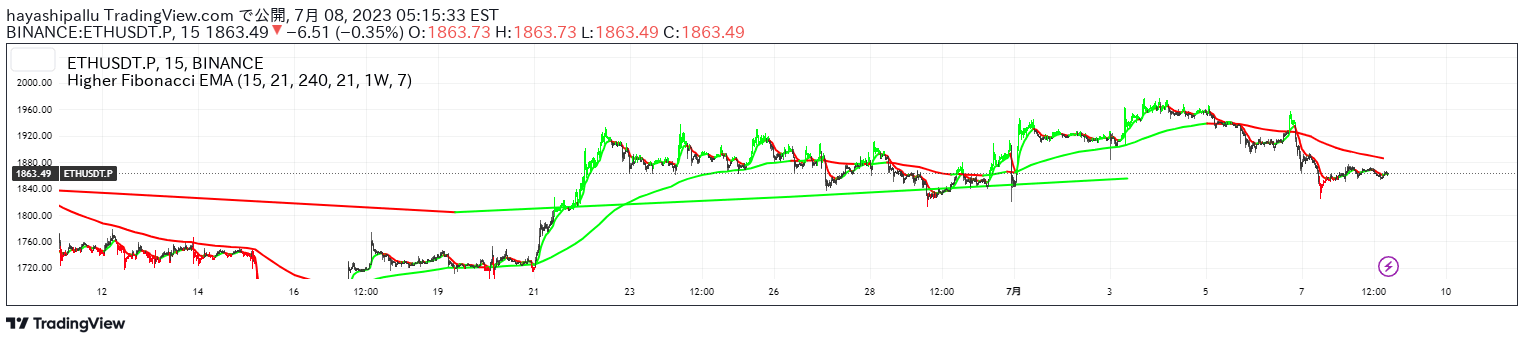
A trend-discriminating indicator using three EMAs across multiple timeframes to identify market direction. Determines trend strength by comparing current closing price to Fibonacci-based EMAs.
Explore complementary indicator rolesHow it works
The indicator calculates three Exponential Moving Averages (EMAs) using Fibonacci-based lengths across different timeframes: current, higher, and top-level. It compares the current closing price against these EMAs to determine trend direction and strength. The EMAs are calculated using specific Fibonacci numbers like 5 and 13 for weekly and daily timeframes respectively.
When the closing price is higher than all three EMAs, the bar is colored green, signaling an uptrend. Conversely, if the price is below the EMAs, the bar turns red, suggesting a potential short entry. If the price is between or around the EMAs, the bar becomes gray, indicating no clear trend direction.
Why it may be useful
This indicator provides traders with a clear, multi-timeframe perspective on market trends, reducing subjective interpretation of price movement. By utilizing Fibonacci-based EMA lengths, it offers a more sophisticated approach to trend identification compared to traditional single-timeframe methods.
The color-coded system allows traders to quickly assess market conditions, enabling faster decision-making and potentially more precise entry and exit points. Its methodology, inspired by the Williams Alligator concept, adds depth to trend analysis by incorporating multiple timeframe perspectives.
When to explore it
The indicator is most effective in markets with clear trending characteristics, particularly in stocks, forex, and cryptocurrency trading. It works best when used alongside other confirmation indicators to validate trend signals and reduce false positives.
Traders should apply this tool during periods of consistent market movement, avoiding choppy or highly volatile market conditions where trend signals might be less reliable. It is particularly useful for day and swing traders who seek to understand broader market momentum across different timeframes.
Keep exploring
What we’ve verified
Access, alerts and repainting behaviour have not been independently verified for this indicator. Check the creator’s current publication and settings.
General descriptions and classifications are recovered research. Verified details above identify the specific checks we have completed. Check the creator’s current publication for later changes.


