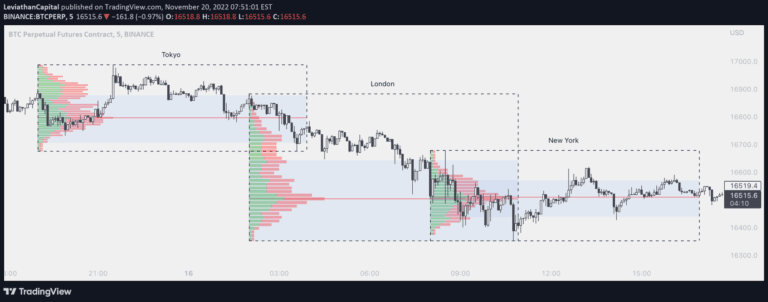
A volume-based volatility algorithm used in Paratica that helps traders analyze market dynamics by examining volume fluctuations and potential price variations.
Explore complementary indicator rolesHow it works
The algorithm calculates volatility by examining trading volume patterns and intensity. It tracks changes in volume across different time periods to identify potential market shifts. By analyzing volume spikes and consistency, the indicator generates signals about market movement potential.
The calculation likely involves comparing current volume to historical averages and detecting significant deviations. This approach helps traders understand underlying market sentiment and potential price volatility. The algorithm processes volume data to create meaningful insights about market dynamics. Its computational method transforms raw volume information into actionable trading signals
Why it may be useful
Volume-based volatility indicators provide crucial insights into market behavior and potential price movements. They help traders understand the strength and conviction behind price changes. By examining volume, traders can confirm trend sustainability and identify potential reversals.
These indicators offer a deeper understanding of market psychology and investor sentiment. They can reveal hidden market dynamics not immediately apparent from price action alone. Traders can use this information to make more informed trading decisions and manage risk more effectively. The algorithm adds an extra layer of analysis beyond traditional price-based indicators
When to explore it
This algorithm works best in markets with significant trading volume and clear market trends. It is most effective during periods of high market activity and notable price movements. Traders should apply this indicator during volatile market conditions or when analyzing stocks with consistent trading volumes.
It can be particularly useful in identifying potential trend confirmations or reversals. The algorithm is most valuable when combined with other technical analysis tools. Traders should consider using it in conjunction with price action and trend indicators. It is especially beneficial for day traders and swing traders seeking comprehensive market insights
Keep exploring
What we’ve verified
Access, alerts and repainting behaviour have not been independently verified for this indicator. Check the creator’s current publication and settings.
General descriptions and classifications are recovered research. Verified details above identify the specific checks we have completed. Check the creator’s current publication for later changes.