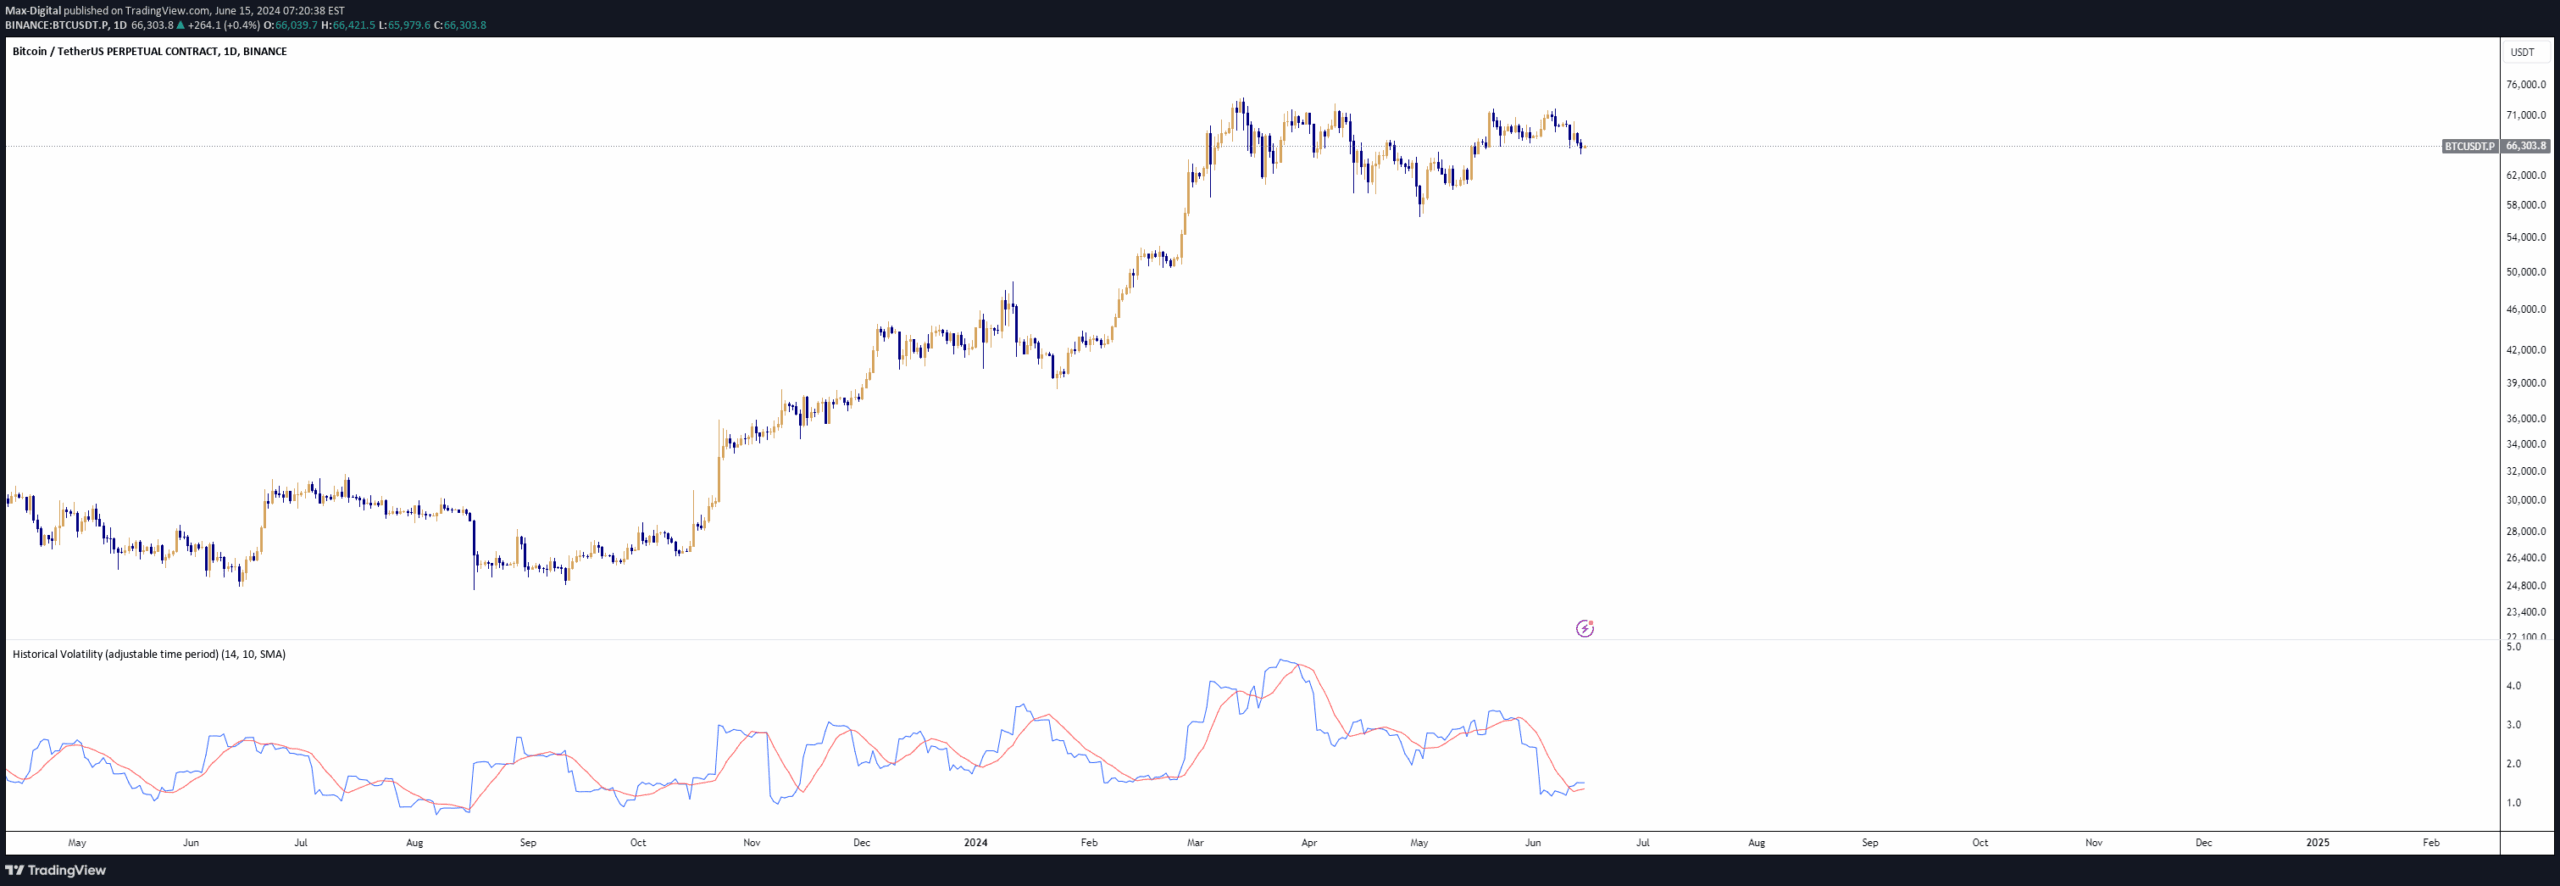
Historical volatility indicator that calculates price return dispersion over a custom time period, helping traders assess market risk and potential price fluctuations with optional moving average smoothing.
Explore complementary indicator rolesHow it works
The historical volatility indicator begins by calculating daily returns as the percentage change between current and previous closing prices. These percentage changes are then used to compute the standard deviation, which quantifies the dispersion of returns over a specified time period.
Users can customize the calculation by selecting a specific date range and defining the number of bars for volatility analysis. The indicator provides flexibility through an optional moving average overlay, which can be configured with different types like Simple, Exponential, Weighted, or Volume-Weighted to help smooth and trend the volatility data.
Why it may be useful
Historical volatility is crucial for understanding market risk and potential price movements, providing traders with insights into an asset's price behavior. By measuring return dispersion, traders can quantify the degree of uncertainty and potential price fluctuations, which is essential for making informed trading decisions.
The ability to analyze volatility over custom time periods allows traders to assess market conditions during specific events or timeframes. This granular approach helps in identifying periods of market stability or potential trend changes, enabling more precise risk management and strategic trading approaches.
When to explore it
This indicator is most effective when analyzing market conditions during specific historical periods or events that might impact asset price movements. Traders can use it to assess risk levels, identify potential volatility shifts, and understand how different market events influence price fluctuations.
The historical volatility indicator is particularly valuable during market transitions, earnings announcements, economic reports, or periods of significant news that might cause increased price uncertainty. By providing a quantitative measure of price dispersion, traders can adjust their strategies, set appropriate stop-loss levels, and make more informed trading decisions.
Keep exploring
What we’ve verified
Access, alerts and repainting behaviour have not been independently verified for this indicator. Check the creator’s current publication and settings.
General descriptions and classifications are recovered research. Verified details above identify the specific checks we have completed. Check the creator’s current publication for later changes.