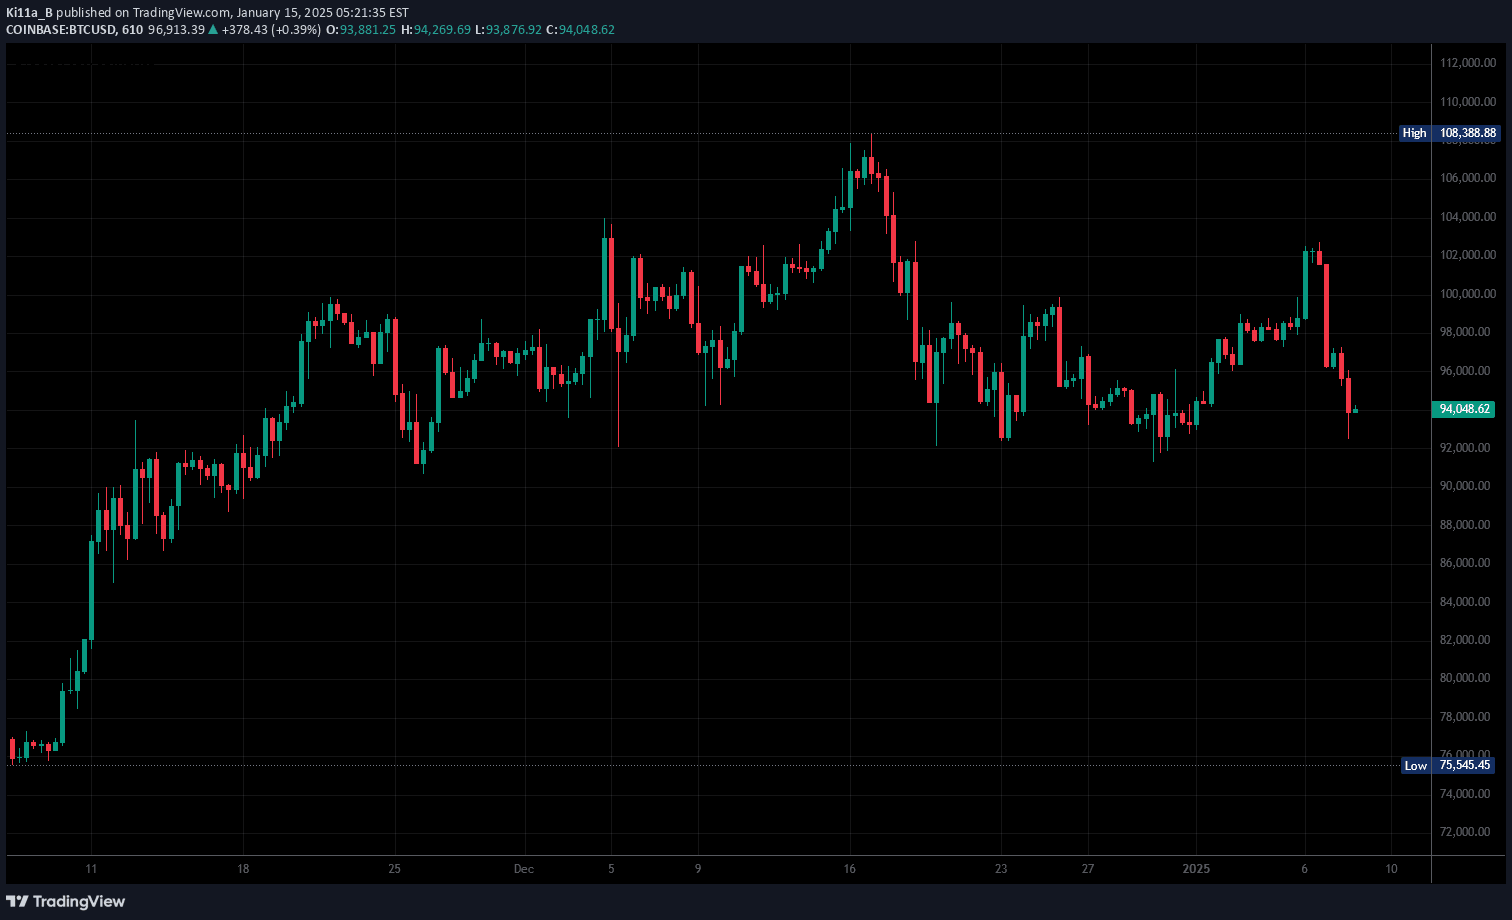
A trading indicator that draws horizontal lines spaced 10% apart to help traders visualize price volatility and track market momentum through volume display.
Explore complementary indicator rolesHow it works
The indicator begins by calculating horizontal lines from the current price point, with each line representing a 10% price increment. These evenly spaced lines create a visual grid that allows traders to quickly understand price fluctuations and potential resistance or support levels.
When traders zoom in or out of the chart, these horizontal lines dynamically adjust, providing a consistent framework for analyzing price movements. Additionally, the indicator includes a volume display measured in USD at the current candle position, which helps traders understand the market's momentum and potential price direction.
Why it may be useful
This indicator simplifies complex price movement analysis by providing a clear, intuitive visual representation of market volatility. By breaking down price ranges into consistent 10% increments, traders can more easily identify potential entry and exit points and understand the market's current dynamics.
The volume display adds another critical layer of insight, allowing traders to correlate price movements with trading volume. This helps traders confirm trend strength, potential reversals, and overall market sentiment, making decision-making more informed and strategic.
When to explore it
The indicator is most effective in markets with moderate to high volatility, where price movements are significant enough to create meaningful 10% increments. It is particularly useful for traders who prefer visual trading approaches and need quick, at-a-glance understanding of price ranges.
Traders engaged in short-term trading strategies, such as scalping and day trading, will find this tool most beneficial. It helps them quickly assess price fluctuations and market momentum, enabling faster and more precise trading decisions in fast-moving market conditions.
Keep exploring
What we’ve verified
Access, alerts and repainting behaviour have not been independently verified for this indicator. Check the creator’s current publication and settings.
General descriptions and classifications are recovered research. Verified details above identify the specific checks we have completed. Check the creator’s current publication for later changes.