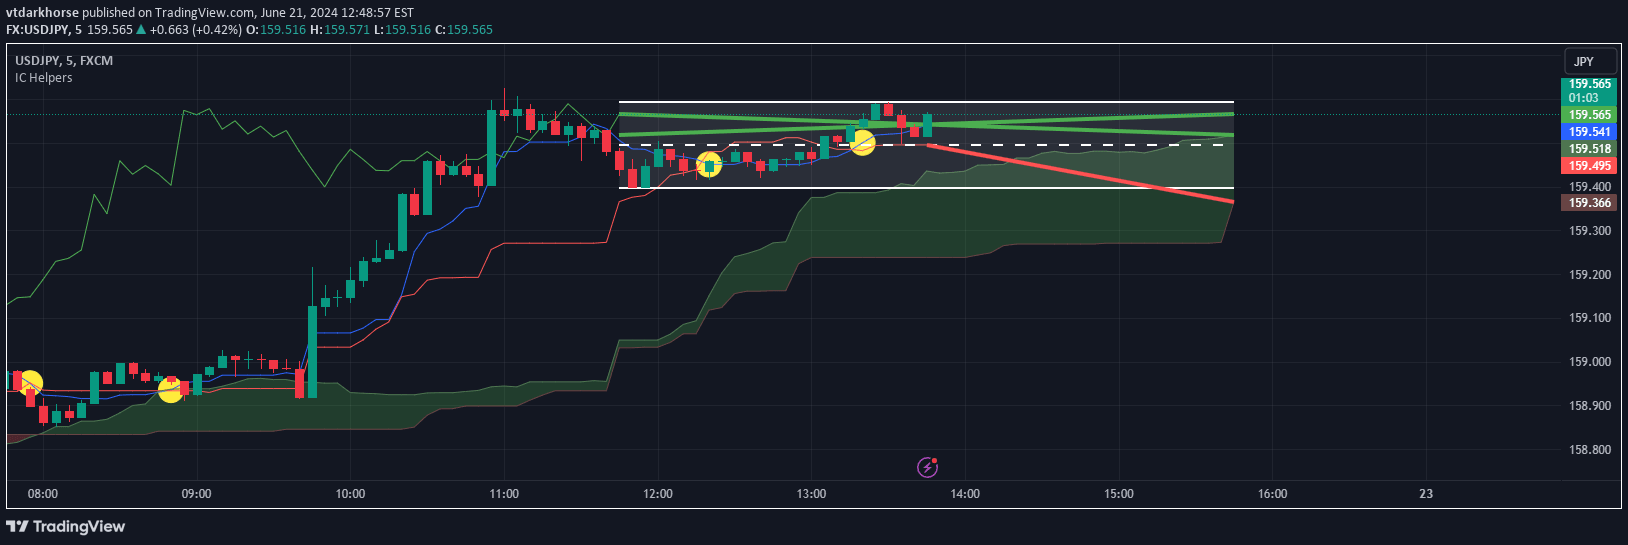
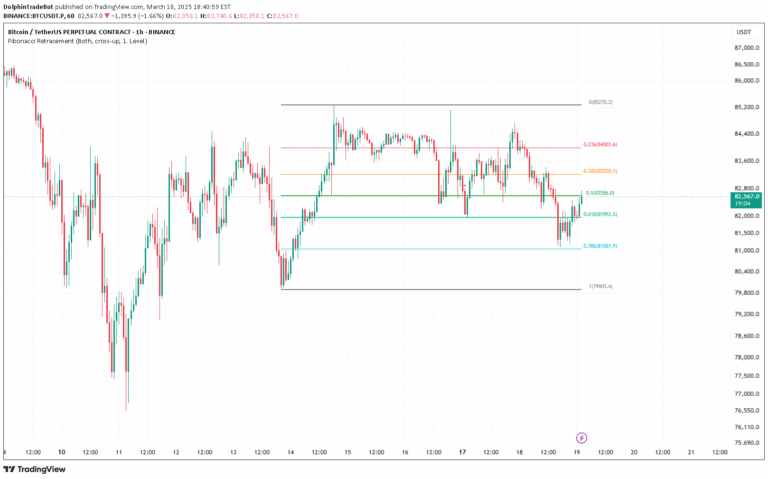
The Hosoda Waves indicator predicts potential future price ranges by calculating waves based on previous market highs and lows, offering traders insights into potential market movements.
Explore complementary indicator rolesHow it works
The Hosoda Waves indicator calculates four specific waves: NT, N, V, and E, using previous price points to project potential future price ranges. Traders identify three points in a price movement, either low-high-low or high-low-high, which form the basis for wave calculations.
Each wave is computed through specific formulas that relate the current price points to previous market movements. These calculations help traders understand potential price projection points by mathematically extrapolating from past market behavior, creating a predictive framework for potential future price ranges.
Why it may be useful
The Hosoda Waves indicator provides traders with a systematic approach to understanding potential market movements by mathematically deriving future price projections from historical price action. It offers a structured method for anticipating potential market turning points and range expansions based on precise calculations.
By offering a quantitative method to project potential price ranges, the indicator helps traders make more informed decisions about market entry and exit points. The waves serve as potential support and resistance levels, giving traders additional context for understanding potential market behavior beyond traditional technical analysis methods.
When to explore it
The Hosoda Waves indicator is most effective in markets with clear directional movements and distinct price swings, where historical price patterns can provide meaningful insights into future market behavior. Traders should use this indicator in conjunction with other technical analysis tools to confirm potential trading signals.
This indicator works best in markets with sufficient historical price data and when traders can clearly identify significant low and high points in recent price movements. It is particularly useful for traders seeking a mathematical approach to understanding potential future price ranges across various timeframes and market instruments.
Keep exploring
What we’ve verified
Access, alerts and repainting behaviour have not been independently verified for this indicator. Check the creator’s current publication and settings.
General descriptions and classifications are recovered research. Verified details above identify the specific checks we have completed. Check the creator’s current publication for later changes.