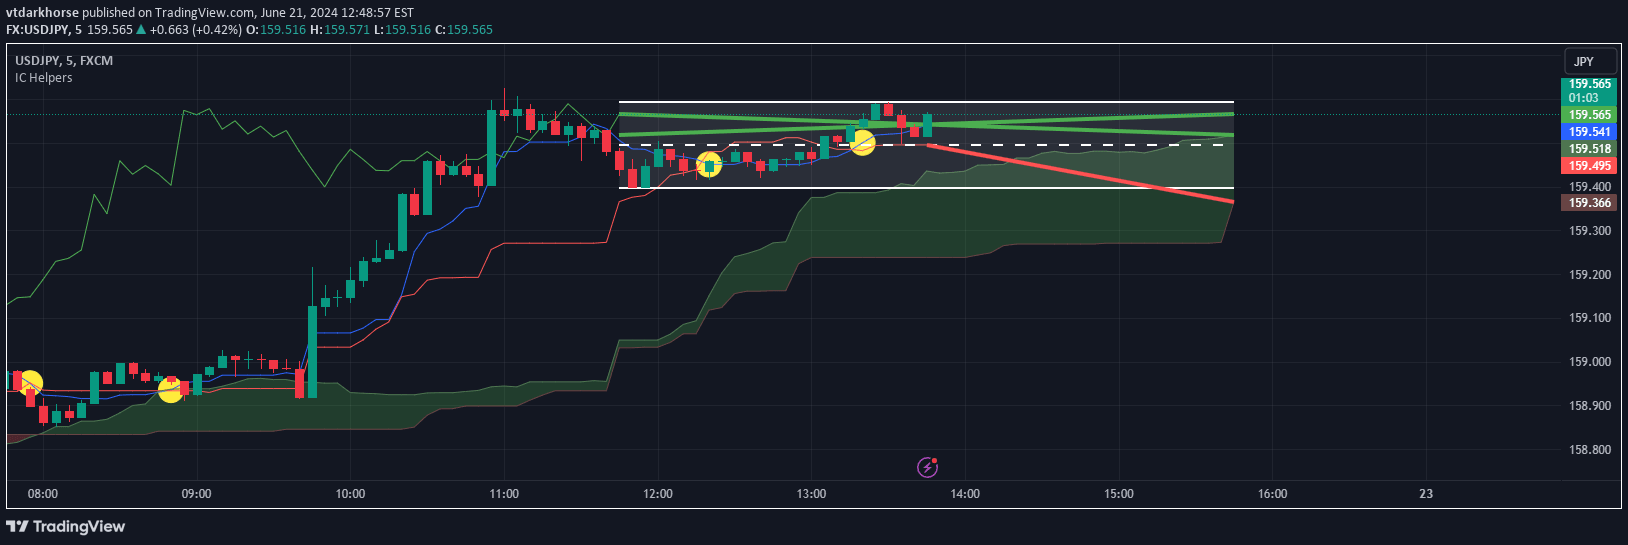
An Ichimoku-based indicator that analyzes price momentum using color-coded bands and a 50 EMA to provide trend insights and potential trading ranges.
Explore complementary indicator rolesHow it works
The indicator calculates the price average over the last twenty-five bars, creating a unique visualization of market momentum. It uses blue and white bands to represent upward and downward momentum respectively, providing a visual representation of market direction.
The red line represents the 50 EMA (Exponential Moving Average), which acts as a dynamic support and resistance level. This creates a comprehensive view of price movement, allowing traders to quickly assess the current market trend and potential entry or exit points.
Why it may be useful
By combining multiple technical analysis elements, this indicator offers traders a more holistic view of market dynamics. It helps traders identify potential trend directions and momentum shifts quickly and intuitively, reducing the complexity of market analysis.
The integrated EMA and color-coded bands provide multiple layers of information, allowing traders to make more informed decisions. This approach helps traders understand market sentiment and potential price movements with greater clarity and confidence.
When to explore it
The indicator is most effective on 5-minute and 15-minute timeframes, where short-term market dynamics are most visible. Traders should use it in conjunction with other trading strategies to confirm signals and reduce false positives.
It is particularly useful for traders looking to capture short-term momentum shifts and identify potential entry or exit points. However, caution is advised on lower timeframes, and traders should always conduct their own research and use multiple confirmation signals.
Keep exploring
What we’ve verified
Access, alerts and repainting behaviour have not been independently verified for this indicator. Check the creator’s current publication and settings.
General descriptions and classifications are recovered research. Verified details above identify the specific checks we have completed. Check the creator’s current publication for later changes.