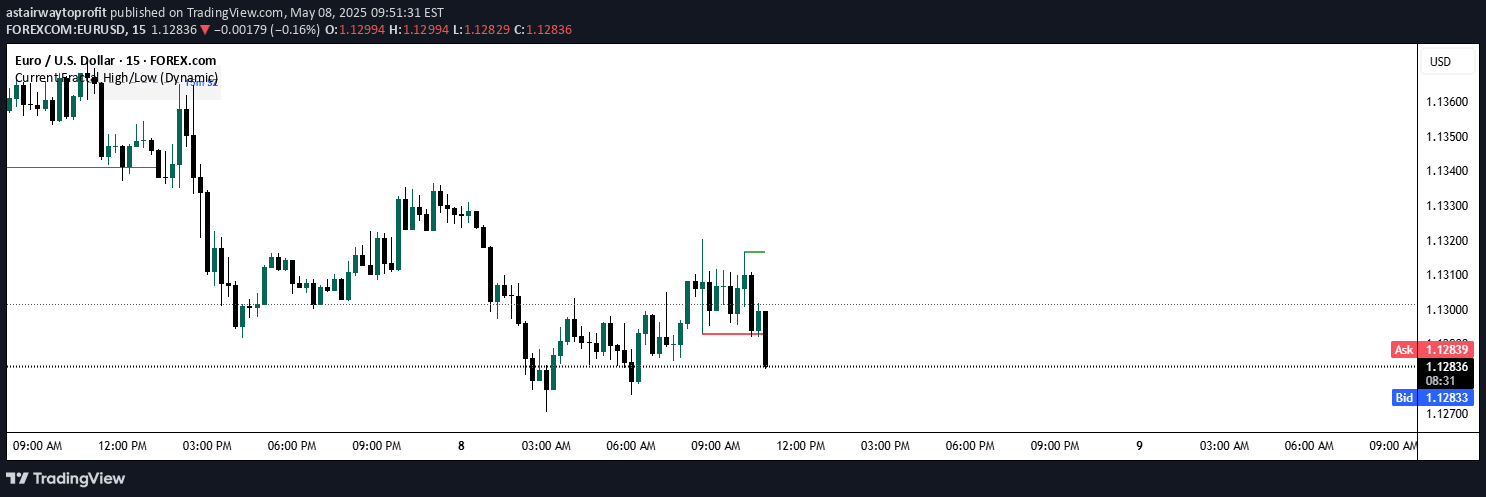
A trading signal identifying potential market reversals by detecting liquidity sweeps through fractal-based analysis, focusing on price rejection at key historical levels.
Explore complementary indicator rolesHow it works
The QL sweep signal uses Williams 3 fractals to identify meaningful market highs and lows, saving historical price levels for analysis. When a candle reaches a previous fractal level but shows immediate rejection by closing back within that level, the script recognizes it as a potential liquidity sweep.
The algorithm continuously tracks multiple historical fractals, not just the most recent one, allowing for comprehensive market analysis. When a sweep occurs, the script triggers an alert and can mark the specific event on the chart, enabling traders to quickly identify potential reversal opportunities across different timeframes.
Why it may be useful
Liquidity sweeps provide traders with a probabilistic method of identifying potential market reversals by highlighting moments when price momentarily breaks key levels but fails to sustain momentum. This approach helps traders recognize moments of potential trend change by observing how market participants interact with critical price zones.
By offering an automated alert system, the signal saves traders significant time and mental energy, allowing them to monitor multiple markets and timeframes simultaneously. The method provides a structured approach to identifying high-probability reversal scenarios based on market structure and liquidity dynamics.
When to explore it
The QL sweep signal works best in markets with clear historical support and resistance levels and sufficient liquidity. It is particularly effective in analyzing timeframes where market structure and participant behavior are more pronounced and predictable.
Traders should use this signal as a confirmation tool rather than a standalone entry mechanism, combining it with additional technical or fundamental analysis. It is most suitable for markets like forex, futures, and liquid stock indices where price action tends to be more responsive to liquidity dynamics.
Keep exploring
What we’ve verified
Access, alerts and repainting behaviour have not been independently verified for this indicator. Check the creator’s current publication and settings.
General descriptions and classifications are recovered research. Verified details above identify the specific checks we have completed. Check the creator’s current publication for later changes.