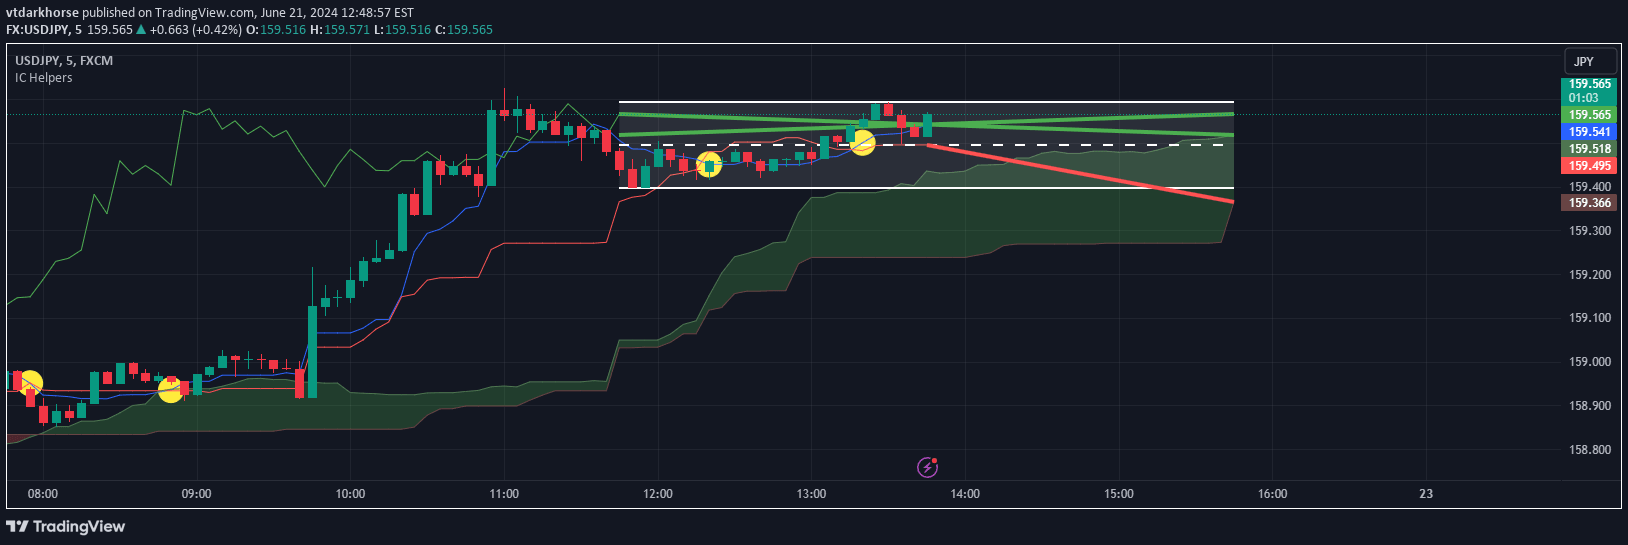
The Ichimoku Cloud Crosses indicator tracks crossovers between Tenkan-sen and Kijun-sen lines to generate bullish and bearish trading signals based on trend momentum.
Explore complementary indicator rolesHow it works
The Ichimoku Cloud Crosses indicator utilizes two key moving lines: the Tenkan-sen (Conversion Line) and Kijun-sen (Base Line). These lines are calculated by finding the midpoint of the highest high and lowest low over specific periods, with default settings of 21 and 120 periods respectively.
When the Tenkan-sen crosses above the Kijun-sen, a yellow triangle appears below the price bar, signaling a potential long entry. Conversely, when the Tenkan-sen crosses below the Kijun-sen, a fuchsia triangle appears above the price bar, indicating a potential short entry.
Why it may be useful
The Ichimoku Cloud Crosses indicator provides traders with a clear visual representation of trend momentum and potential trend reversals. By tracking the relationship between short-term and medium-term trend lines, traders can quickly identify potential trading opportunities without complex analysis.
This indicator simplifies trend identification by using color-coded signals and triangular markers, making it easier for traders to spot potential entry and exit points. The visual nature of the indicator allows for quick decision-making and helps traders understand market dynamics at a glance.
When to explore it
The Ichimoku Cloud Crosses indicator works best in trending markets with clear directional movement. It is particularly effective for traders seeking quick signal generation and momentum-based trading strategies across various financial instruments.
Traders should use this indicator in conjunction with other technical analysis tools to confirm signals and reduce false positives. It is most suitable for short to medium-term trading timeframes, especially in markets with sufficient liquidity and consistent price action.
Keep exploring
What we’ve verified
Access, alerts and repainting behaviour have not been independently verified for this indicator. Check the creator’s current publication and settings.
General descriptions and classifications are recovered research. Verified details above identify the specific checks we have completed. Check the creator’s current publication for later changes.