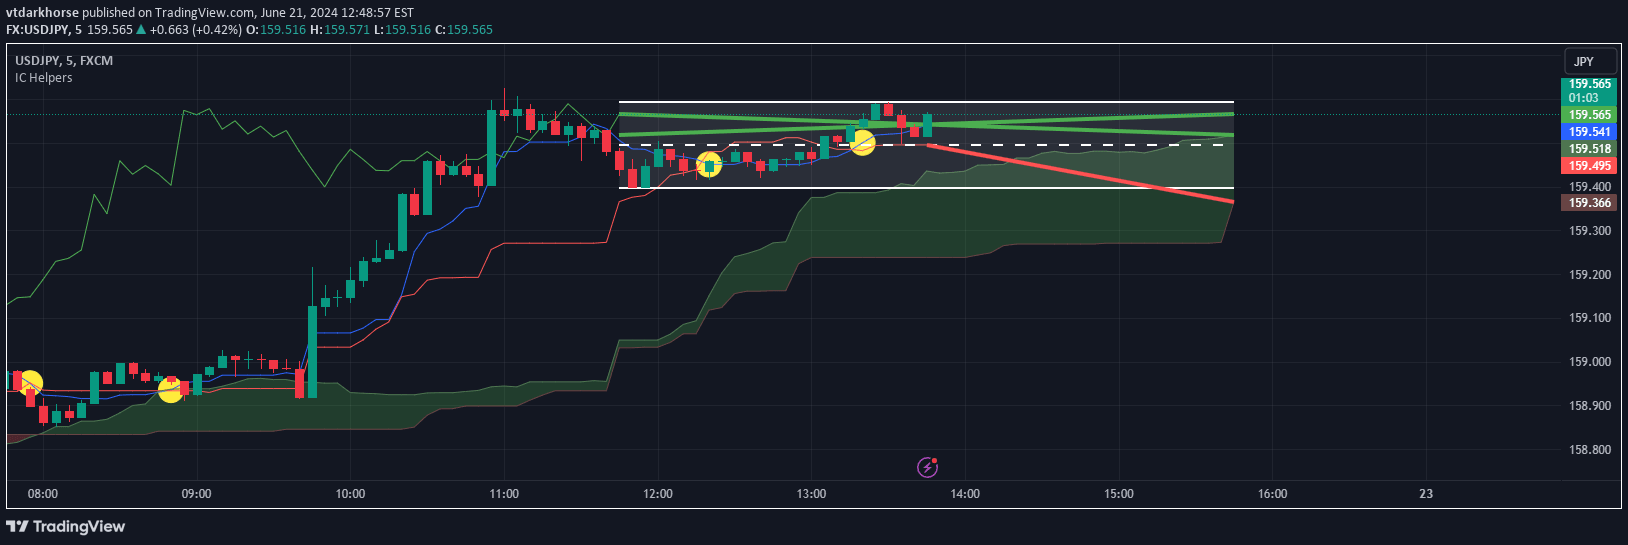
Advanced Ichimoku Cloud indicator that combines traditional cloud analysis with Pearson correlation and multi-timeframe momentum tracking for comprehensive market trend identification.
Explore complementary indicator rolesHow it works
The Ichimoku Cloud Plus operates by integrating multiple technical analysis components to assess market trends and momentum. It calculates key elements like the Conversion Line, Base Line, and Leading Spans to create a dynamic cloud formation that visually represents potential support and resistance levels.
The indicator further enhances traditional Ichimoku analysis by incorporating Pearson correlation coefficients and multi-timeframe momentum tracking. It calculates correlations between price movements and time, generates momentum percentages across five different timeframes, and uses statistical methods to validate trend strength and potential reversal points.
Why it may be useful
The Ichimoku Cloud Plus provides traders with a statistically robust and visually comprehensive market analysis tool that goes beyond traditional technical indicators. By combining multiple analytical techniques, it offers deeper insights into market trends, helping traders make more informed decisions with increased confidence in their analysis.
The indicator's unique approach of integrating Pearson correlation, multi-timeframe momentum, and traditional Ichimoku cloud analysis creates a powerful framework for understanding market dynamics. This comprehensive methodology reduces the likelihood of false signals and provides traders with a more nuanced view of potential market movements.
When to explore it
The Ichimoku Cloud Plus is most effective in markets with clear trending characteristics, particularly in forex, cryptocurrency, and major stock index trading. It performs exceptionally well during periods of sustained directional movement, where multiple timeframe confirmations can provide high-probability trading opportunities.
Traders should leverage this indicator during market conditions with moderate to high volatility, where its multi-timeframe analysis and statistical correlation can help identify robust trend formations. It is particularly valuable when seeking to confirm trend strength, potential reversals, and entry/exit points across different trading styles and timeframes.
Keep exploring
What we’ve verified
Access, alerts and repainting behaviour have not been independently verified for this indicator. Check the creator’s current publication and settings.
General descriptions and classifications are recovered research. Verified details above identify the specific checks we have completed. Check the creator’s current publication for later changes.