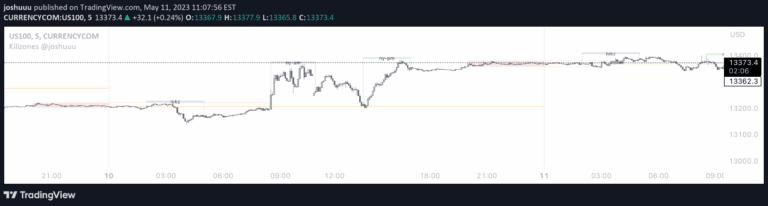
ICT Macro Sessions Indicator highlights key institutional trading periods across different market sessions, helping traders identify high-probability trading windows with precision.
Explore complementary indicator rolesHow it works
The ICT Macro Sessions Indicator works by automatically mapping and visually highlighting specific time intervals where institutional trading activity is most likely to occur. It uses unique background colors to mark each macro session, allowing traders to quickly identify these critical time windows across different market sessions like London and New York.
The indicator is pre-configured for GMT+8 timezone but automatically adapts to the user's local time. By focusing on these predefined sessions, traders can align their strategies with potential price movements driven by institutional activity, making it easier to anticipate market volatility and liquidity changes.
Why it may be useful
The indicator provides traders with a strategic advantage by revealing when institutional traders are most active, which can significantly impact price movements. By understanding these high-probability trading windows, traders can make more informed decisions about market entry and exit points, reducing guesswork and increasing potential trading success.
Institutional trading activity often drives market momentum, and by visualizing these sessions, traders can better synchronize their strategies with larger market participants. The indicator's flexibility in session toggling and optional labeling allows traders to customize their view and focus on the most relevant market periods for their specific trading approach.
When to explore it
The ICT Macro Sessions Indicator is most effective for intraday trading strategies, particularly on timeframes of 45 minutes or less. Traders can utilize this tool during specific macro sessions like London and New York, where price movements are typically more pronounced and liquidity is higher.
It is particularly useful for traders who want to capture short-term price reversals, continuations, or consolidation patterns during institutionally significant time periods. The indicator helps traders focus on the most critical times of the trading day, making it valuable for scalpers and day traders seeking to align their strategies with institutional market dynamics.
Keep exploring
What we’ve verified
Access, alerts and repainting behaviour have not been independently verified for this indicator. Check the creator’s current publication and settings.
General descriptions and classifications are recovered research. Verified details above identify the specific checks we have completed. Check the creator’s current publication for later changes.