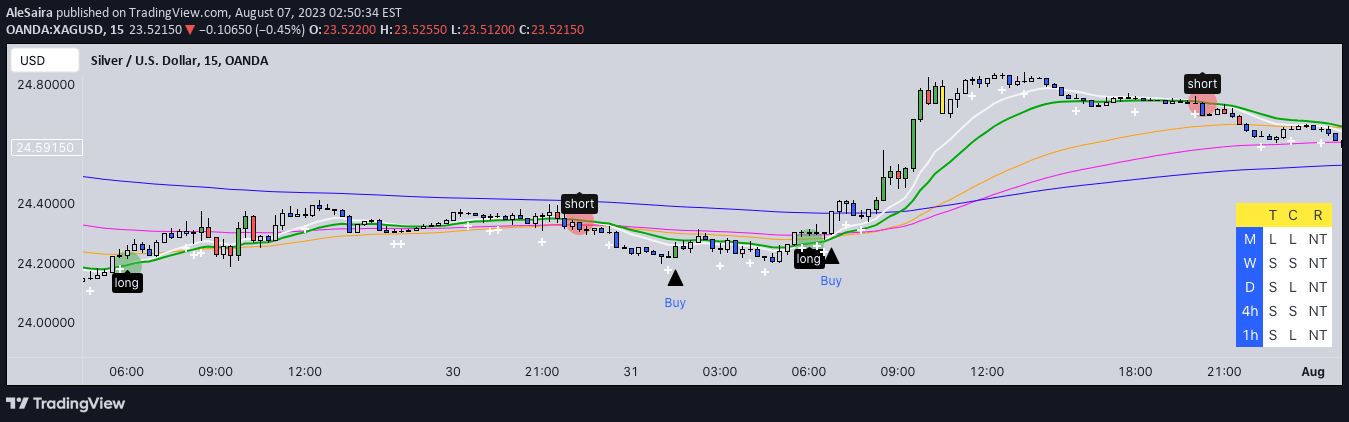
[@btc_charlie] Trader XO Macro Trend Scanner
A trading script combining Exponential Moving Averages (EMAs) and Stochastic RSI to identify market trends, momentum shifts, and potential entry or exit points for traders.
Explore 11,183 indicators. Filter beyond the obvious.
Discover the tools that fit the way you trade.
11,183 tools to explore
A trading script combining Exponential Moving Averages (EMAs) and Stochastic RSI to identify market trends, momentum shifts, and potential entry or exit points for traders.
A comprehensive trading toolkit that identifies critical market zones, institutional liquidity levels, and potential price movement patterns using advanced technical analysis techniques.
ICT Algorithmic Macro Tracker plots key trading time windows based on Inner Circle Trader methodology, helping traders identify potential market movement periods across specific time intervals.
An advanced trading indicator that identifies specific market timing intervals where algorithmic trading creates or interacts with liquidity at predetermined times.
An advanced trend detection tool that uses EMA crossovers to identify market flow, dynamic price levels, and trend momentum with visual gradient bands.
The Corrected Moving Average (CMA) is an adaptive moving average system designed to minimize false signals in sideways markets and provide more accurate trend identification across different market conditions.
A trading script that visualizes macro trading windows by marking specific time intervals with vertical lines and labels to help traders anticipate potential market liquidity and price movements.
Advanced trading signal that calculates precise intersection points between two data series, offering detailed insights into potential trend changes and crossover events.
ICT Macros is a trading tool that identifies key market moments, highlighting critical time intervals for trading opportunities based on liquidity shifts and price dynamics.
Zero-lag TEMA Crosses is a technical indicator that reduces moving average lag by using Triple Exponential Moving Average (TEMA) calculation to identify faster trend changes.
A comprehensive trading indicator that combines multiple technical analysis tools like EMA crossovers, candle patterns, trend directions, and RSI to provide multi-timeframe trading insights.
A scalping and day trading indicator using three Fibonacci EMAs to identify trend direction, potential reversals, and entry points with color-coded visual signals.
Likes, views, and comments are historical TradingView snapshots. They describe attention, not trading performance.