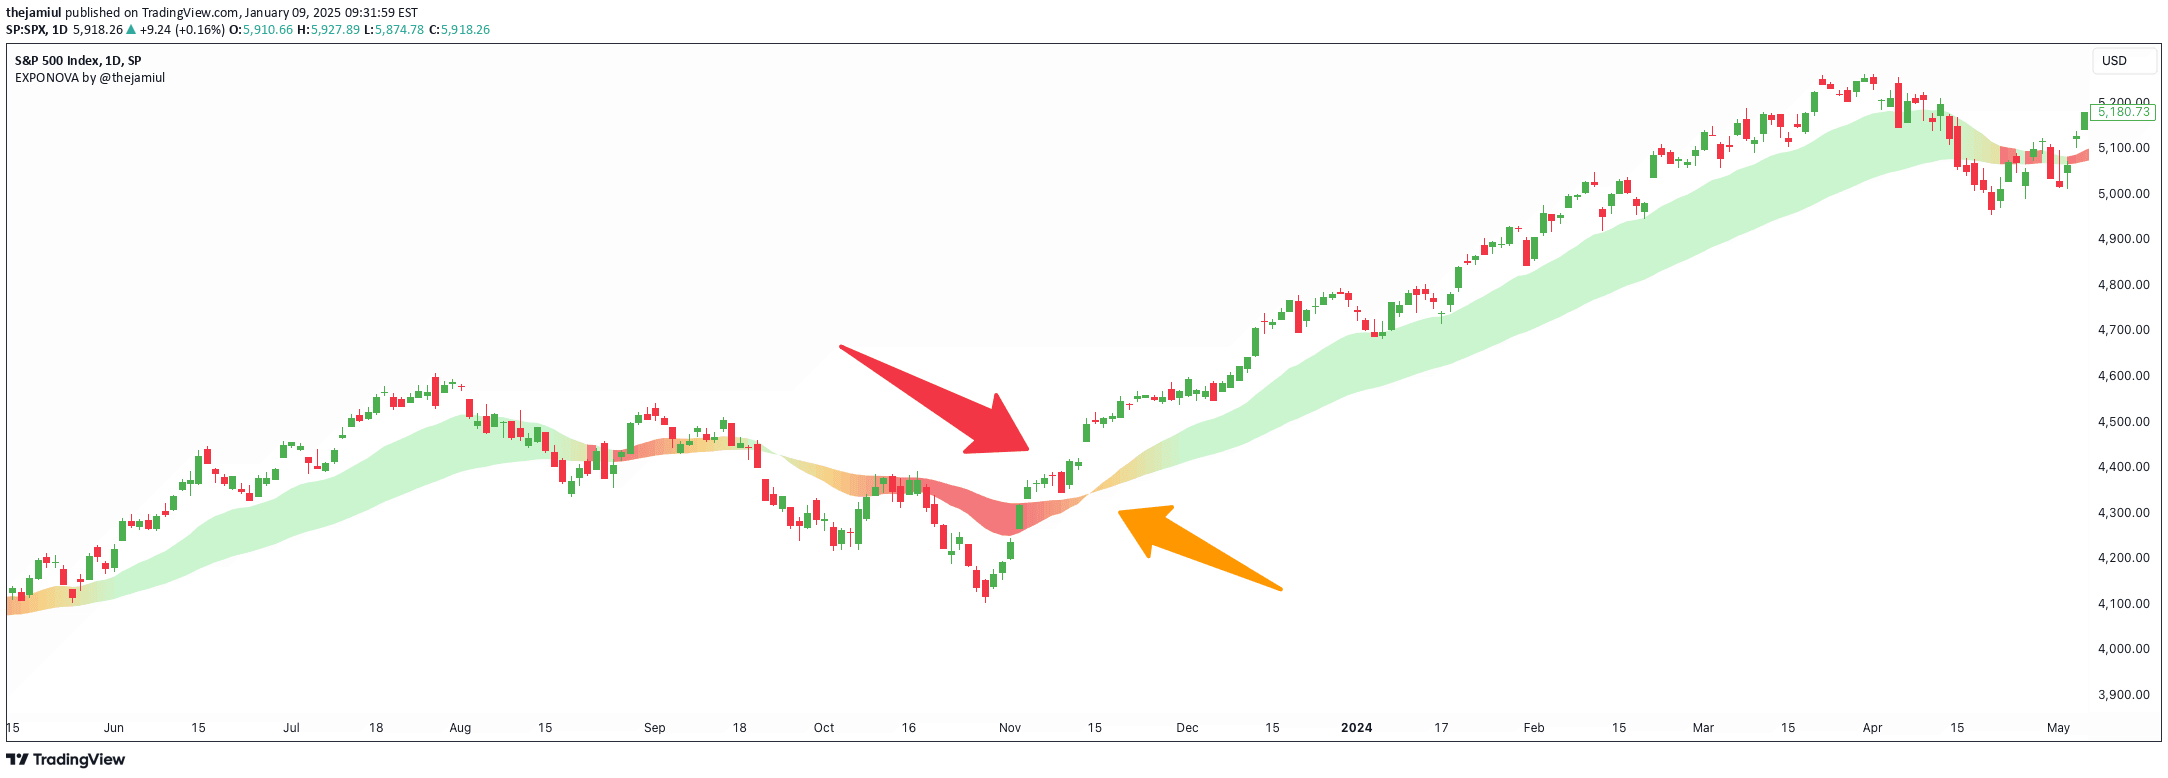
A scalping and day trading indicator using three Fibonacci EMAs to identify trend direction, potential reversals, and entry points with color-coded visual signals.
Explore complementary indicator rolesHow it works
The indicator uses three Exponential Moving Averages (EMAs) based on Fibonacci numbers: 21, 55, and 233. These EMAs are color-coded to show trend direction and potential trading opportunities. When the Micro EMA is below the Mid and Macro EMAs, the line turns red, signaling a potential bearish trend and short opportunities.
When the Micro EMA is above the Mid and Macro EMAs, the line turns green, indicating a potential bullish trend and long opportunities. A white Micro EMA suggests a neutral market condition where traders should avoid trading. Additionally, the indicator provides visual signals like red and green diamonds and crosses to mark potential trend beginnings and reversals.
Why it may be useful
This indicator simplifies trend identification by using color-coded EMAs, making it easier for traders to quickly understand market direction. By leveraging Fibonacci-based moving averages, it provides a systematic approach to trend analysis that can help traders make more informed decisions about entry and exit points.
The visual signals of diamonds and crosses offer clear, objective markers for potential trend changes, reducing emotional decision-making. These signals can be particularly helpful for traders who struggle with identifying optimal trading moments or tend to overtrade.
When to explore it
The indicator is most effective in shorter timeframes, specifically 5-minute to 1-hour charts, making it ideal for scalping and day trading strategies. It works best in markets with clear trending conditions, where price movements are more defined and directional.
Traders should use this indicator in conjunction with other momentum and confirmation indicators like Market Cipher B to validate signals and identify precise entry points. It is not recommended to blindly follow the signals but instead use them as part of a comprehensive trading strategy that includes risk management and additional technical analysis.
Keep exploring
What we’ve verified
Access, alerts and repainting behaviour have not been independently verified for this indicator. Check the creator’s current publication and settings.
General descriptions and classifications are recovered research. Verified details above identify the specific checks we have completed. Check the creator’s current publication for later changes.