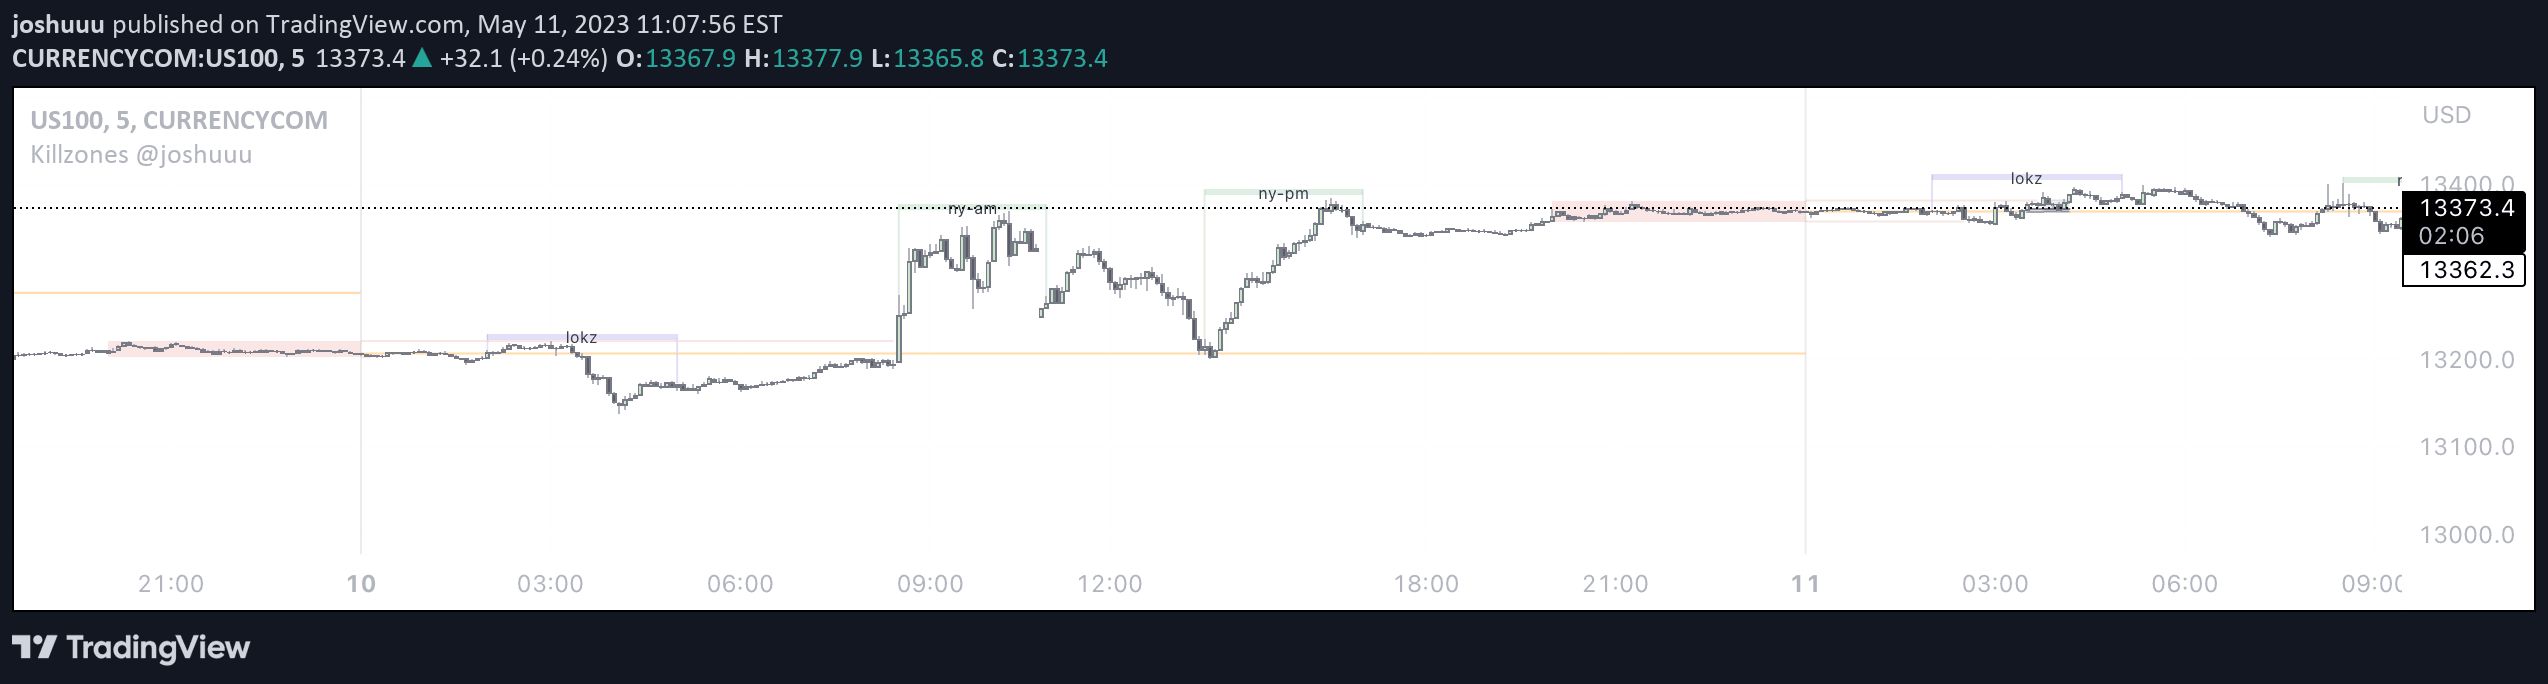
An indicator based on ICT Killzones that identifies high-volume trading sessions in forex and indices markets, highlighting optimal trading periods with clean price movement.
Explore complementary indicator rolesHow it works
The ICT Killzones indicator identifies specific time windows with historically high trading volume and clean price movement for forex and indices markets. It focuses on three primary sessions: London (0200-0500), New York AM (0700-1010 for forex, 0830-1100 for indices), and New York PM (1330-1600 for indices).
The indicator can be displayed either as labels above current price bars or as visual lines on the chart. By highlighting these specific trading sessions, traders can quickly recognize periods of potentially higher market activity and more predictable price action.
Why it may be useful
The Killzones indicator provides traders with a strategic approach to identifying high-probability trading windows based on historical market behavior. By concentrating on sessions with typically higher volume and cleaner price movement, traders can improve their timing and reduce the likelihood of trading during low-liquidity periods.
This tool helps traders focus their attention on specific timeframes where market dynamics are more predictable, potentially leading to more informed trading decisions and improved risk management strategies.
When to explore it
The Killzones indicator is most effective for day traders and scalpers in forex and indices markets who want to optimize their trading during peak market activity. It works best during the specified time windows when institutional traders are most active and market liquidity is highest.
Traders should use this indicator to identify potential entry and exit points during these high-volume sessions, while also considering other technical and fundamental analysis tools to confirm trading signals.
Keep exploring
What we’ve verified
Access, alerts and repainting behaviour have not been independently verified for this indicator. Check the creator’s current publication and settings.
General descriptions and classifications are recovered research. Verified details above identify the specific checks we have completed. Check the creator’s current publication for later changes.