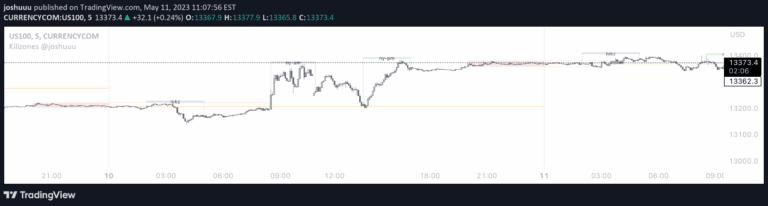
An advanced trading indicator that highlights key market sessions and time windows for potential price movements, focusing on ICT killzones and Silver Bullet times across different trading markets.
Explore complementary indicator rolesHow it works
The indicator automatically identifies and marks specific trading session times for different markets, including Forex and other financial instruments. It displays ICT killzones for Asia, London, and New York sessions, with precise time windows that vary slightly depending on the market type.
Additionally, the indicator highlights Silver Bullet times, which are specific one-hour windows known for potentially significant price movements. These time windows are preset at 0300-0400, 1000-1100, and 1400-1500, allowing traders to focus on these potentially high-energy trading periods.
Why it may be useful
Understanding market session times and specific trading windows can provide traders with crucial insights into potential price behavior and liquidity dynamics. These predefined time zones help traders identify periods of increased market activity, potential liquidity seeking, and significant price movements.
By visualizing these specialized time windows, traders can improve their timing, prepare for potential market shifts, and develop more strategic entry and exit points. The indicator essentially transforms abstract market session concepts into clear, actionable visual information.
When to explore it
This indicator is most effective for traders focusing on intraday and short-term trading strategies, particularly in forex and similar fast-moving markets. It works best during active trading sessions when market liquidity and volatility are typically higher, such as during London and New York market hours.
Traders should pay special attention to the Silver Bullet times, which are known for potentially significant price movements. The indicator is particularly useful for those interested in understanding market structure, liquidity dynamics, and timing-based trading strategies.
Keep exploring
What we’ve verified
Access, alerts and repainting behaviour have not been independently verified for this indicator. Check the creator’s current publication and settings.
General descriptions and classifications are recovered research. Verified details above identify the specific checks we have completed. Check the creator’s current publication for later changes.