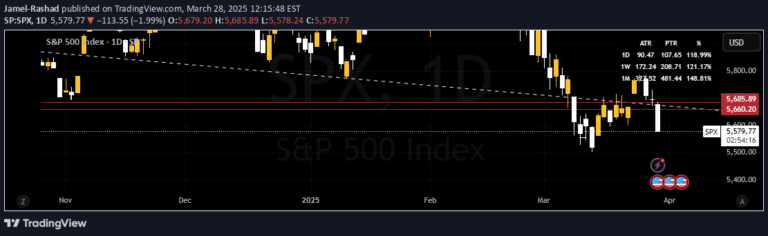
A dynamic volatility indicator that plots multiple implied volatility levels using standard deviation calculations to help traders identify market thresholds and potential reversal points.
Explore complementary indicator rolesHow it works
The Implied Volatility Levels Indicator calculates standard deviation of closing prices over a specified lookback period, typically 252 days. It generates multiple volatility levels by adding and subtracting standard deviation multiples from the mean price.
These calculated levels are then plotted as distinct dotted lines on the trading chart, providing visual representations of market volatility. The indicator dynamically updates in real-time, ensuring traders have access to current market conditions without outdated information.
Why it may be useful
Volatility indicators are crucial for understanding market dynamics and potential price movements. They help traders assess market risk, identify potential support and resistance levels, and make more informed trading decisions based on historical price fluctuations.
By providing a visual framework of market volatility, this indicator allows traders to quickly gauge market conditions and potential trend reversals. The multi-level approach offers a comprehensive view of price behavior beyond traditional single-level indicators.
When to explore it
This indicator is most effective during periods of market uncertainty or when traders need a comprehensive view of potential price ranges. It works particularly well in markets with significant price movements and can help identify potential entry and exit points.
Traders can utilize this indicator across various timeframes and market conditions, making it versatile for different trading strategies. It is especially useful when combined with other technical analysis tools to confirm market trends and potential trading opportunities.
Keep exploring
What we’ve verified
Access, alerts and repainting behaviour have not been independently verified for this indicator. Check the creator’s current publication and settings.
General descriptions and classifications are recovered research. Verified details above identify the specific checks we have completed. Check the creator’s current publication for later changes.