
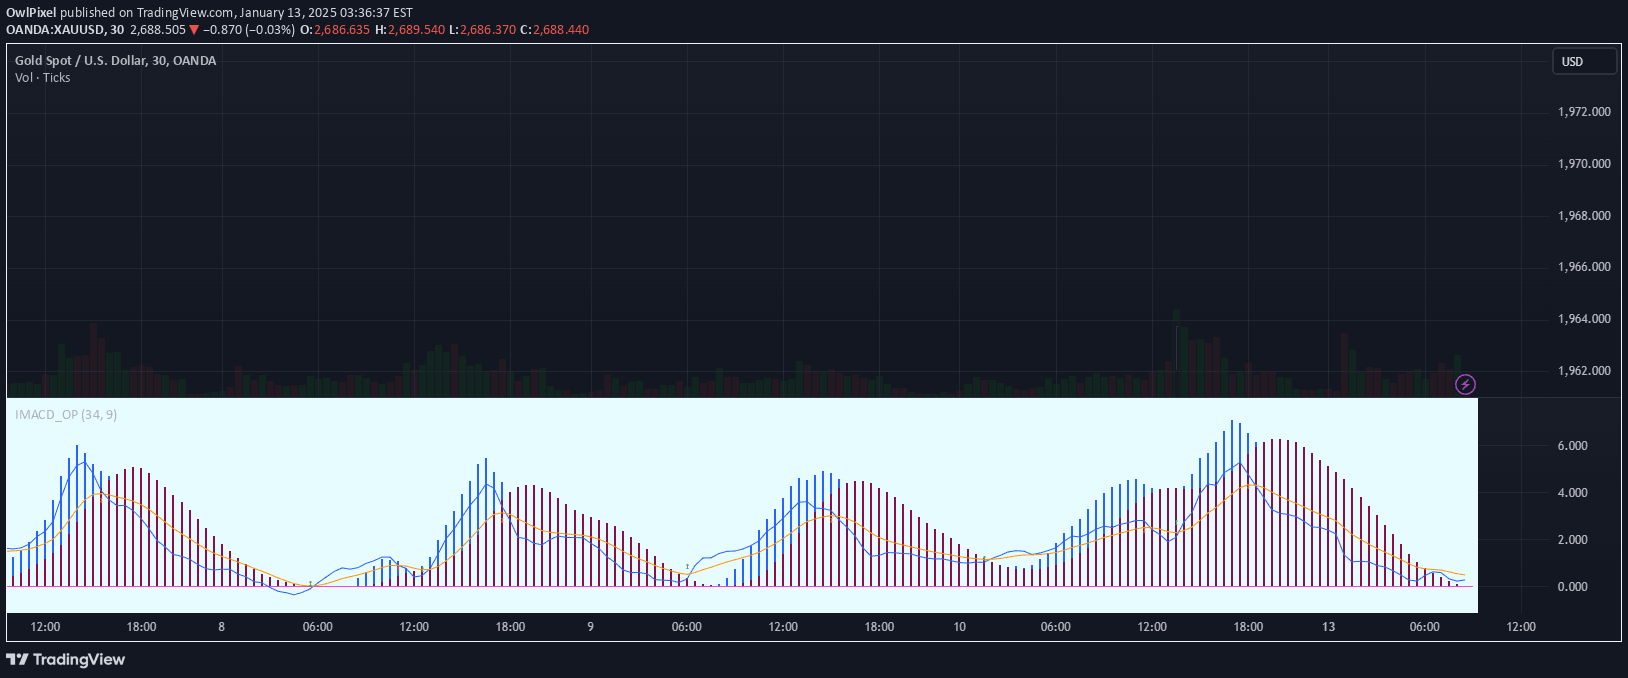
A TradingView Pine Script MACD-based indicator that provides buy signals, momentum analysis, and trend insights through color-coded background boxes and histogram visualization.
Explore complementary indicator rolesHow it works
The Impulse MACD Buy Indicator operates by analyzing the relationship between the MACD line and signal line, creating visual representations of market momentum. It generates a blue histogram showing the difference between these lines, helping traders understand market strength and potential trend shifts.
The indicator also displays background boxes in different colors representing market conditions: light green for uptrends, light red for downtrends, and light yellow for neutral trends. Green circle markers appear when the MACD line crosses above the signal line, signaling potential buy opportunities.
Why it may be useful
The Impulse MACD Buy Indicator provides traders with a comprehensive view of market momentum and trend dynamics through multiple visual elements. By integrating MACD analysis with color-coded trend indicators, traders can quickly assess market conditions and identify potential entry points.
Moreover, the indicator automatically calculates stop loss and take profit levels, helping traders manage risk and optimize their trading strategies. These features make the tool valuable for traders seeking a nuanced understanding of market movements and potential trading opportunities.
When to explore it
The Impulse MACD Buy Indicator is most effective in markets with clear momentum and trending characteristics, such as forex, stocks, and cryptocurrency markets. Traders should use this tool when seeking confirmation of trend changes and potential entry points, particularly during periods of sustained price movement.
It is particularly useful for traders who prefer technical analysis and want a visual representation of market dynamics. However, traders should combine this indicator with other analysis techniques and risk management strategies to make well-informed trading decisions.
Keep exploring
What we’ve verified
Access, alerts and repainting behaviour have not been independently verified for this indicator. Check the creator’s current publication and settings.
General descriptions and classifications are recovered research. Verified details above identify the specific checks we have completed. Check the creator’s current publication for later changes.


