Elliott Wave [LuxAlgo]
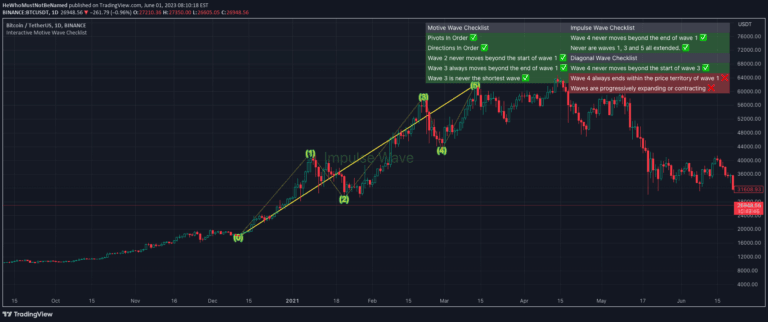
Elliott Wave indicator automatically detects impulse and corrective wave patterns in price movements, helping traders identify potential trend directions and market phases.
Explore 11,183 indicators. Filter beyond the obvious.
Discover the tools that fit the way you trade.
11,183 tools to explore
Elliott Wave indicator automatically detects impulse and corrective wave patterns in price movements, helping traders identify potential trend directions and market phases.
A custom ZigZag indicator that identifies market reversals using momentum indicators, providing true pivot points without repainting and highlighting impulse strength.
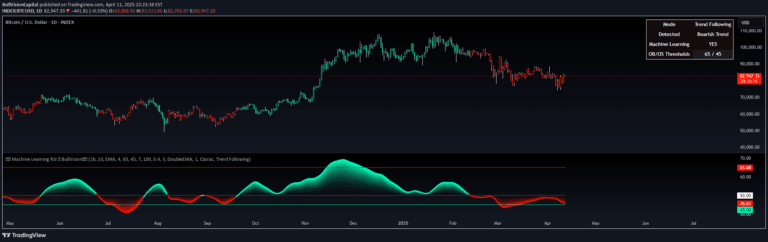
A sophisticated RSI indicator that uses machine learning and K-Nearest Neighbors to dynamically adapt momentum analysis by comparing current market conditions with historical patterns.
A custom moving average using a beta distribution weighting function that allows traders to control lag and smoothness, offering flexible trend analysis with adjustable parameters.
ABC Pattern is a three-wave corrective trading indicator that identifies potential trend reversals and price movements by analyzing impulse and corrective waves in market trends.
A trading signal using Kadane's algorithm to identify the largest market impulse within a window, then applying Murrey's math lines to map potential price movements and trading opportunities.
A trend-following system that uses volatility-scaled steps to track market momentum, visualizing trend progression through discrete channels and adaptive volatility bands.
Elliott Wave analysis is a technical trading method that identifies market trends by examining price wave patterns, helping traders predict potential market movements and trend reversals.
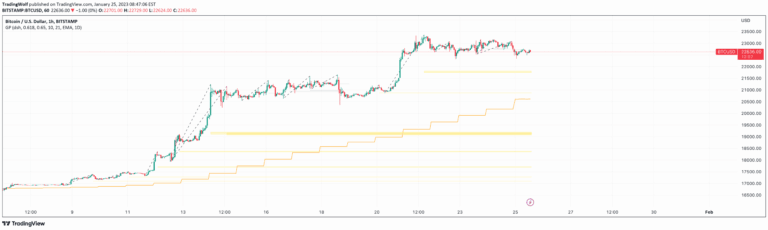
Golden Pocket is a Fibonacci retracement tool that identifies key price levels between 0.618 and 0.65, helping traders find potential entry points during market retracements.
NeuroTrend is an adaptive trend analysis system that dynamically assesses market conditions, providing real-time trend detection with confidence scoring and intelligent market phase classification.
Chart pattern analysis focusing on flag and pennant formations that identify potential trend continuation after strong impulse waves, helping traders anticipate market momentum.
A sophisticated directional movement indicator using Hann windowing to analyze market trends. It enhances traditional Directional Movement Index (DMI) calculations through advanced smoothing techniques.
Likes, views, and comments are historical TradingView snapshots. They describe attention, not trading performance.