
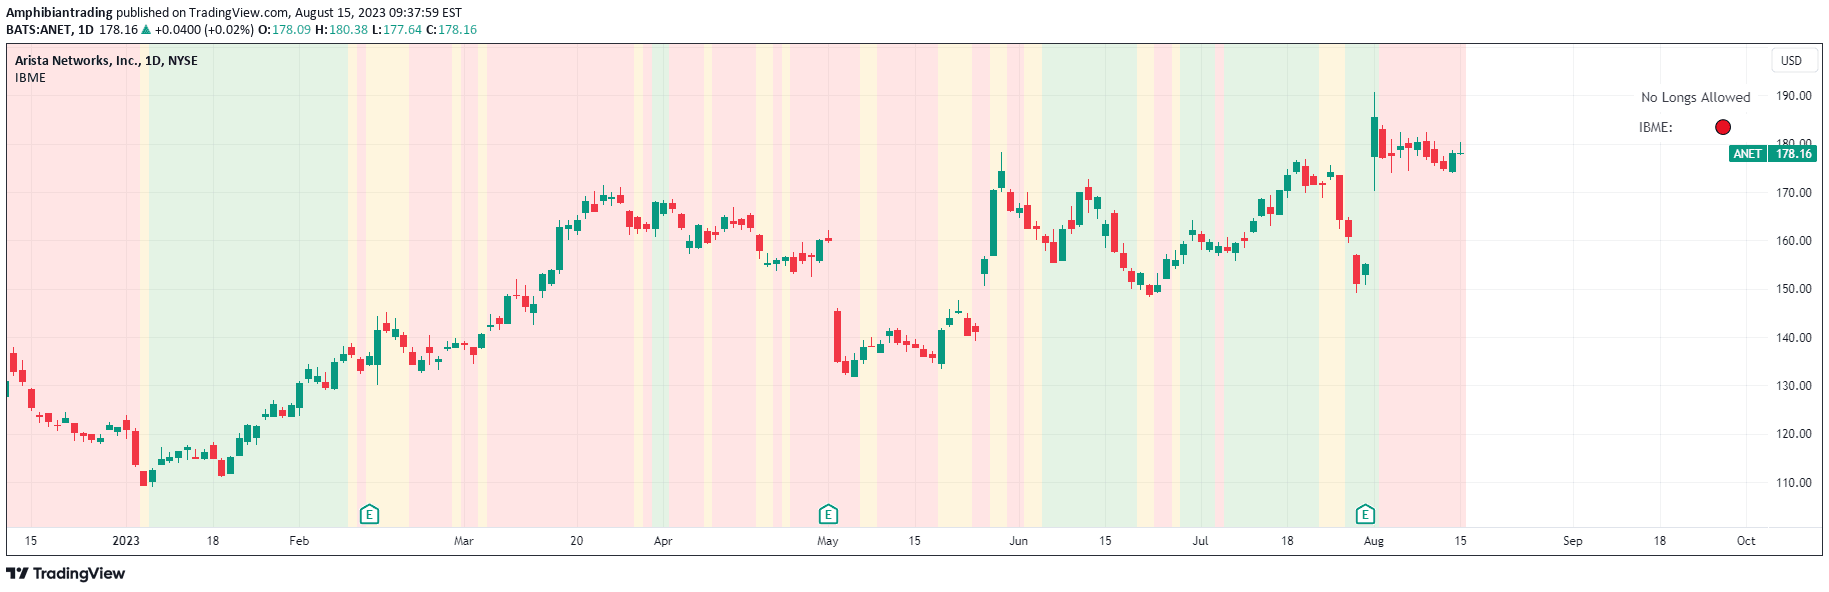
The Indicator Based Market Exposure (IBME) system uses three market breadth signals to determine market health and trading exposure across different market conditions.
Explore complementary indicator rolesHow it works
The IBME system combines three distinct market signals to assess overall market conditions: the McClellan Summation Index, Net New Highs/Lows, and Net New Highs Crossover. Each signal provides insights into market breadth and trend direction by analyzing stock advances, declines, and new highs versus new lows.
The system generates color-coded signals indicating market exposure levels: green for full-size long positions, yellow for pilot positions, and red for no long positions. Traders can adjust their market participation based on these signals, which are designed to provide early warning signs of potential market trend changes.
Why it may be useful
The IBME system offers traders a comprehensive approach to understanding market internals and potential trend shifts by combining multiple breadth indicators. By providing a nuanced view of market health, it helps traders make more informed decisions about market exposure and risk management.
Unlike single-indicator approaches, this system creates a confluence of signals that can provide more reliable insights into market conditions. It allows traders to take a defensive stance when market internals show signs of deterioration, potentially protecting capital during uncertain market periods.
When to explore it
The IBME system is most effective when used on daily time frame charts, particularly for tracking intermediate to major market trends and potential reversals. It is particularly useful for traders seeking a systematic approach to market analysis that goes beyond simple price action.
The indicator works best in markets with clear directional movements and when used in conjunction with other analytical tools. Traders can use it to gauge overall market sentiment, adjust position sizes, and make more strategic entry and exit decisions across different trading styles.
Keep exploring
What we’ve verified
Access, alerts and repainting behaviour have not been independently verified for this indicator. Check the creator’s current publication and settings.
General descriptions and classifications are recovered research. Verified details above identify the specific checks we have completed. Check the creator’s current publication for later changes.


