A UB sell indicator that uses 10-year interest rate volume and price trends to generate selling opportunities by identifying high-volume periods and bullish price movements.
Explore complementary indicator rolesHow it works
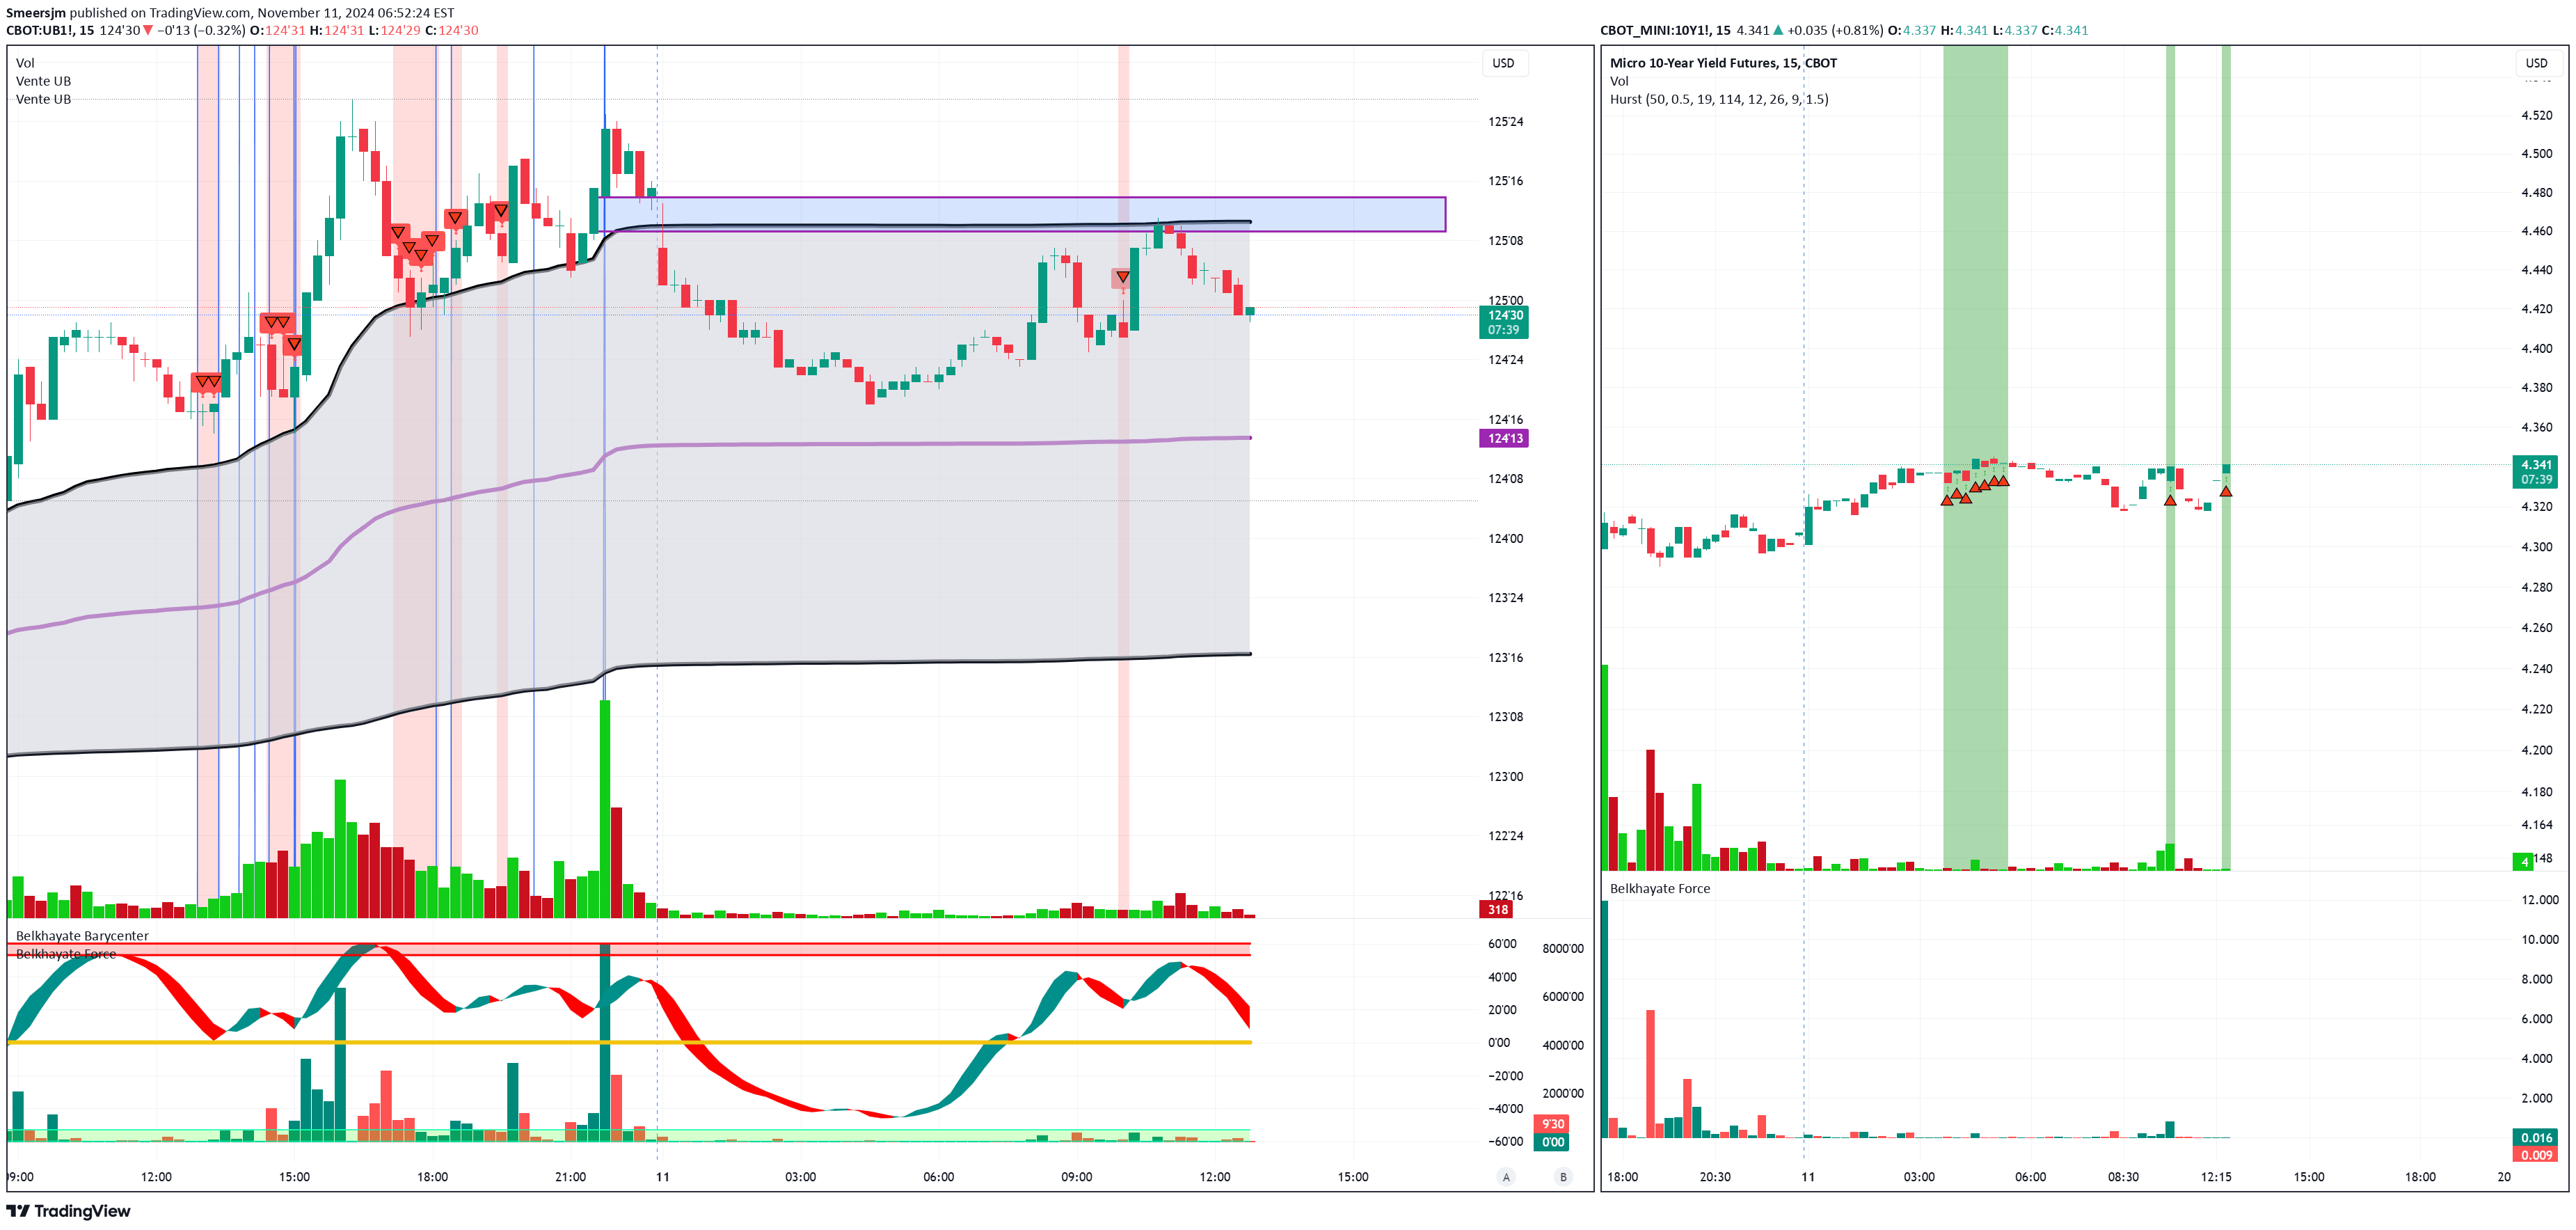
The UB Sell Indicator operates by monitoring the 10-year interest rate (10Y1!) volume and price data to generate precise sell signals. It establishes a fixed volume threshold of 114 and uses a 10-period moving average to analyze the 10Y1! price trend, helping traders identify potential bearish moves on the UB contract.
When the 10Y1! volume exceeds the predefined threshold and the price is simultaneously rising, the indicator triggers a sell signal. This is visually represented by red arrows on the chart, making it easy for traders to quickly recognize and act on selling opportunities in the UB market.
Why it may be useful
The UB Sell Indicator provides traders with a systematic approach to identifying potential selling opportunities in the UB contract by combining volume and price trend analysis. By focusing on the 10-year interest rate dynamics, the indicator offers a unique perspective on market movements that can help traders make more informed decisions.
This signal is particularly valuable because it simplifies complex market information into clear, actionable insights. The visual representation of sell signals through red arrows allows traders to quickly assess potential trading opportunities without extensive manual analysis, potentially improving trading efficiency and decision-making.
When to explore it
The UB Sell Indicator is most effective in markets with clear volume and price trend characteristics, particularly when trading the UB contract. Traders should use this indicator during periods of significant interest rate market activity, where volume and price trends provide meaningful signals.
It is especially useful for traders who focus on short-term trading strategies and want a quick, visual method of identifying potential selling opportunities. The indicator works best when combined with other analytical tools and comprehensive market research to confirm and validate the generated signals.
Keep exploring
What we’ve verified
Access, alerts and repainting behaviour have not been independently verified for this indicator. Check the creator’s current publication and settings.
General descriptions and classifications are recovered research. Verified details above identify the specific checks we have completed. Check the creator’s current publication for later changes.