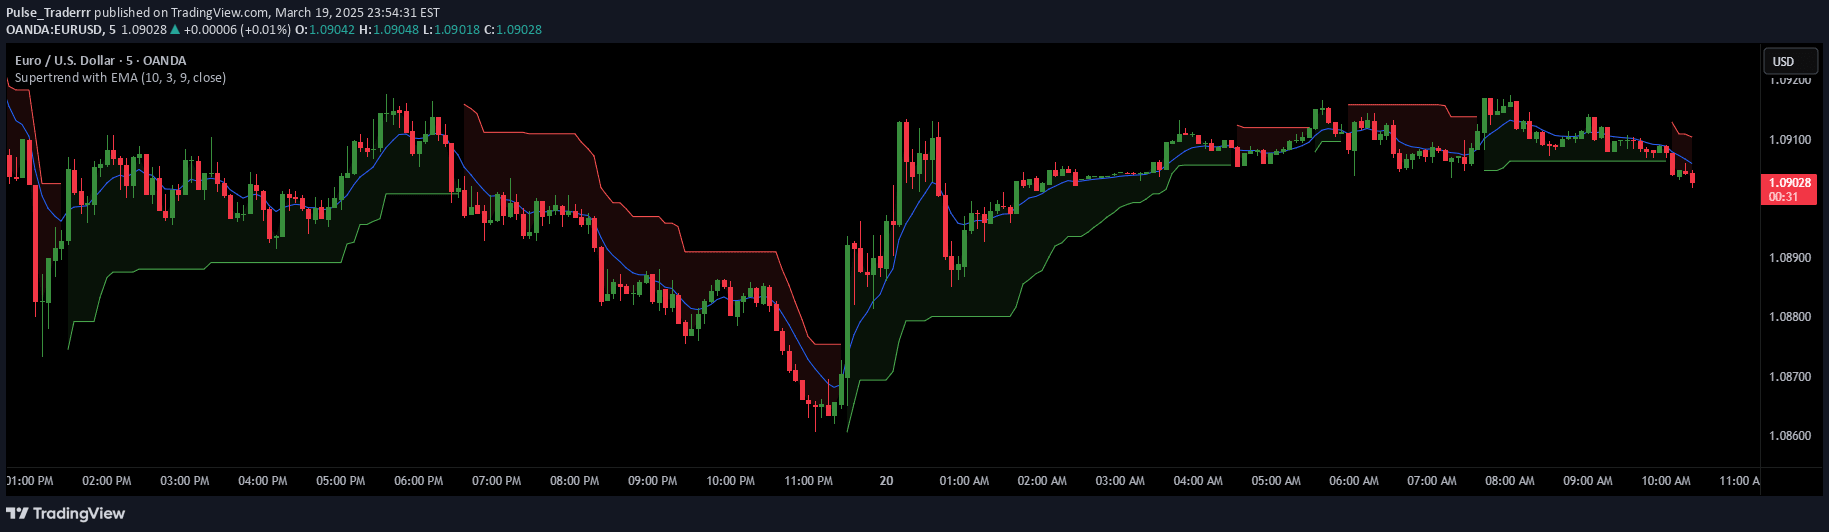
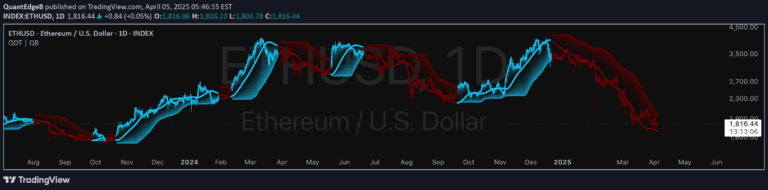
An advanced trendline indicator that uses digital signal processing to create a responsive, smoothed line tracking price movements with a color-coded cloud for trend visualization.
Explore complementary indicator rolesHow it works
The Instantaneous Trendline (ITL) uses a digital filtering approach to calculate a responsive trendline that closely follows price movements. By applying a smoothing coefficient called alpha, the indicator creates a line that balances quick reaction to price changes with noise reduction.
The trendline is plotted alongside the price, with a color-coded cloud highlighting the relationship between price and the ITL. When the price is above the trendline, the cloud turns green, indicating bullish potential, while a red cloud suggests bearish conditions when the price falls below the trendline.
Why it may be useful
The ITL provides traders with a sophisticated method of trend identification that goes beyond traditional moving averages. By incorporating digital signal processing techniques, it offers a more responsive and adaptable view of market momentum, allowing traders to quickly identify potential trend changes and market bias.
The color-coded cloud feature adds an intuitive visual element that makes trend analysis more accessible. Traders can quickly assess market conditions at a glance, with the green and red clouds providing immediate insight into potential bullish or bearish market states.
When to explore it
The Instantaneous Trendline is most effective in markets with clear directional movements, where price trends are more pronounced and sustained. It works particularly well in liquid markets with consistent price action, such as major forex pairs, large-cap stocks, and prominent index futures.
Traders should consider using the ITL in conjunction with other technical indicators to confirm signals and reduce false positives. The indicator's sensitivity can be adjusted by modifying the alpha parameter, making it adaptable to different market conditions and trading styles.
Keep exploring
What we’ve verified
Access, alerts and repainting behaviour have not been independently verified for this indicator. Check the creator’s current publication and settings.
General descriptions and classifications are recovered research. Verified details above identify the specific checks we have completed. Check the creator’s current publication for later changes.