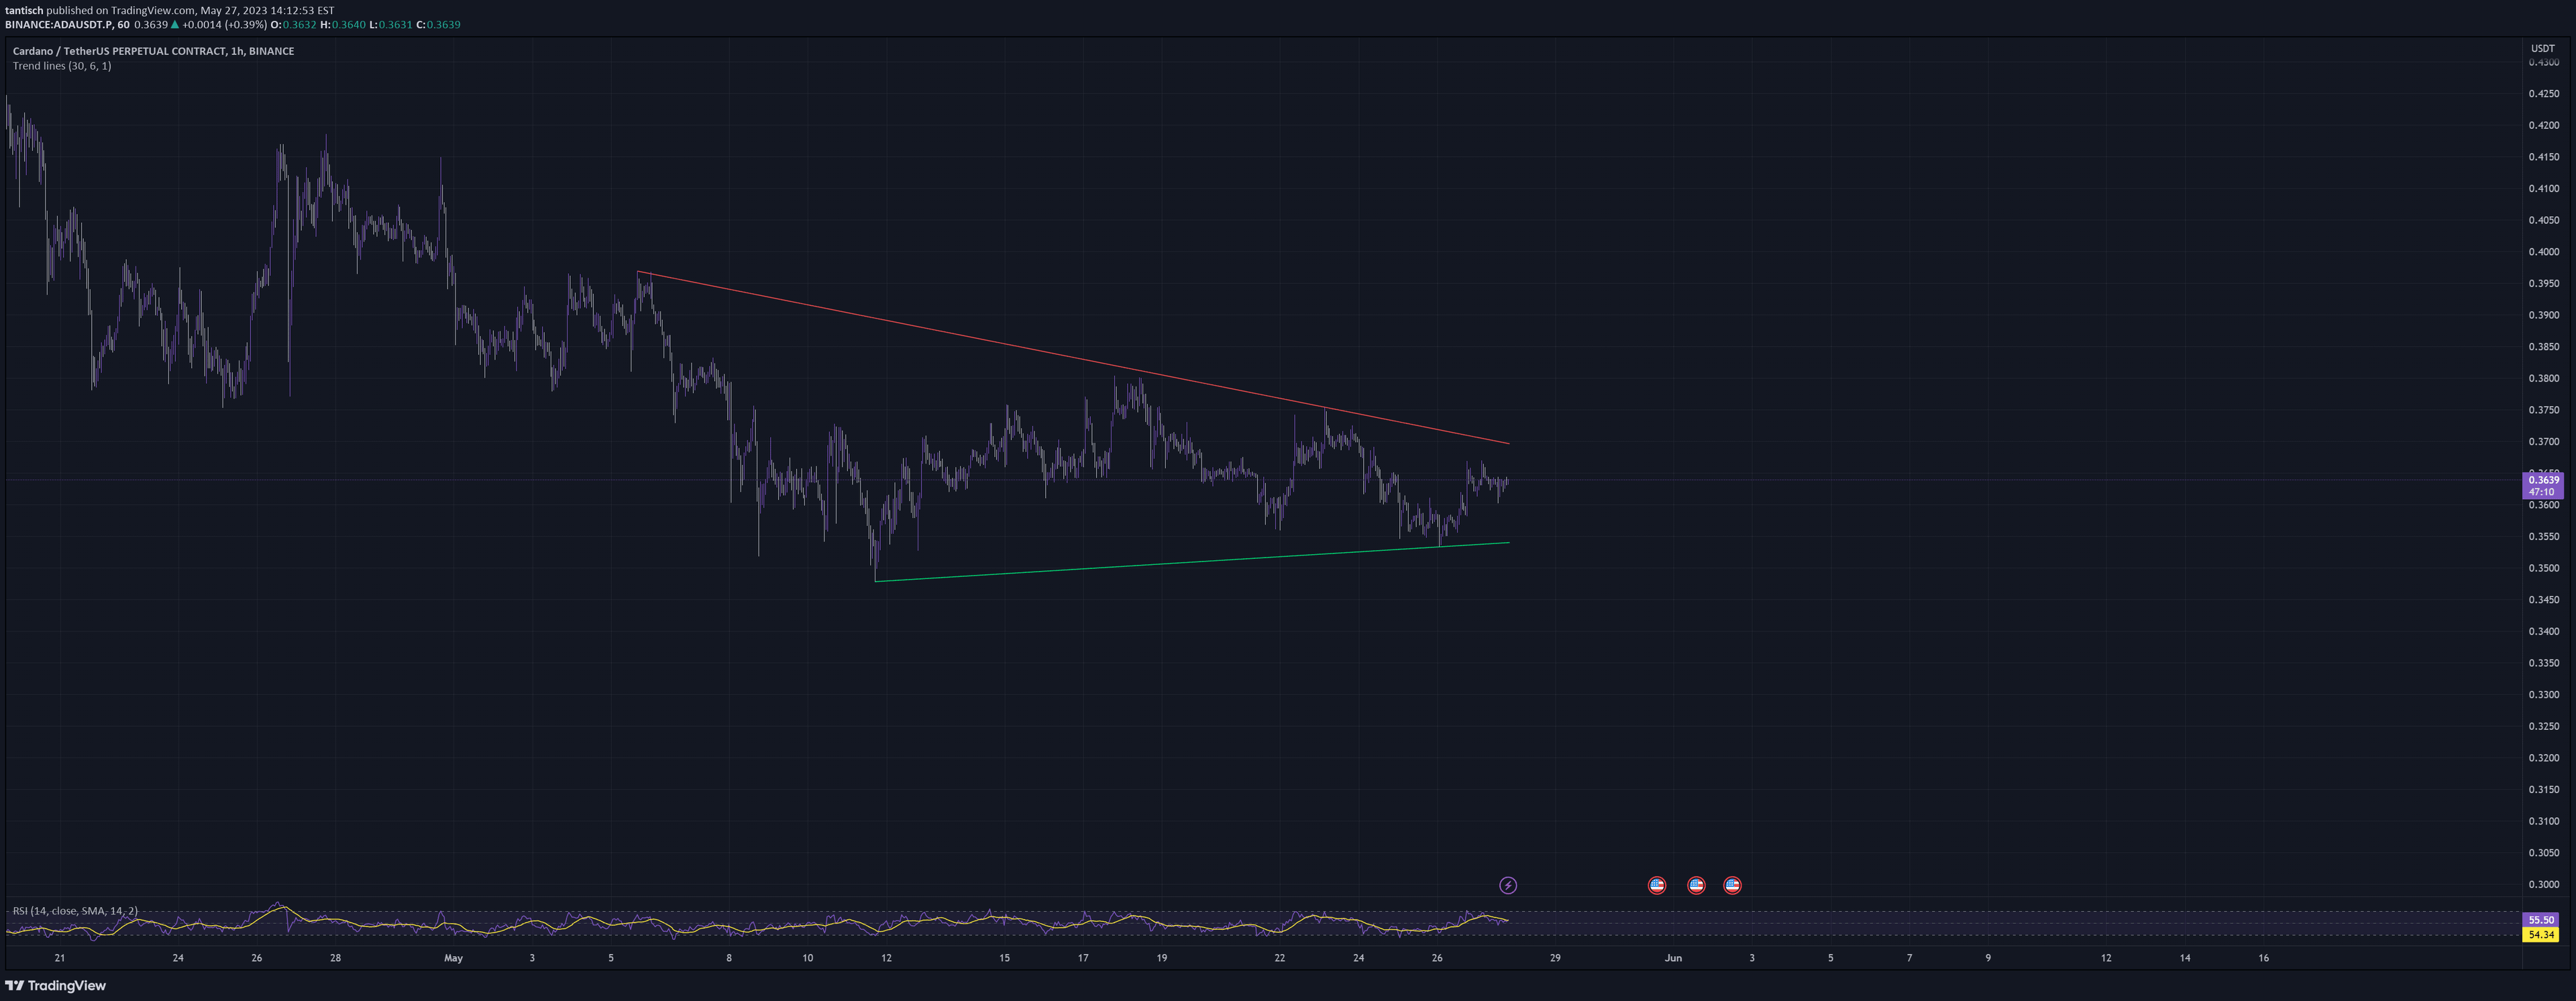
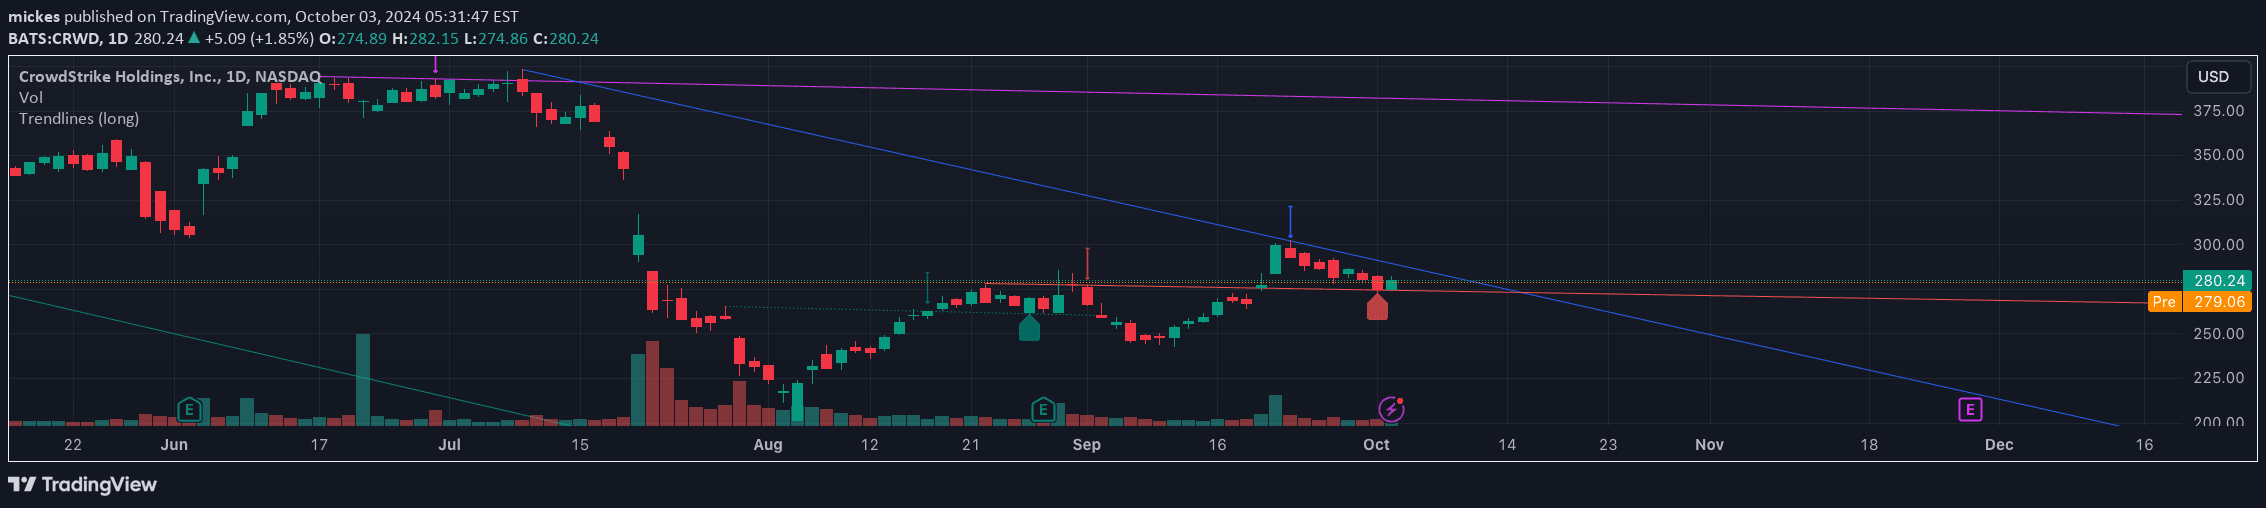
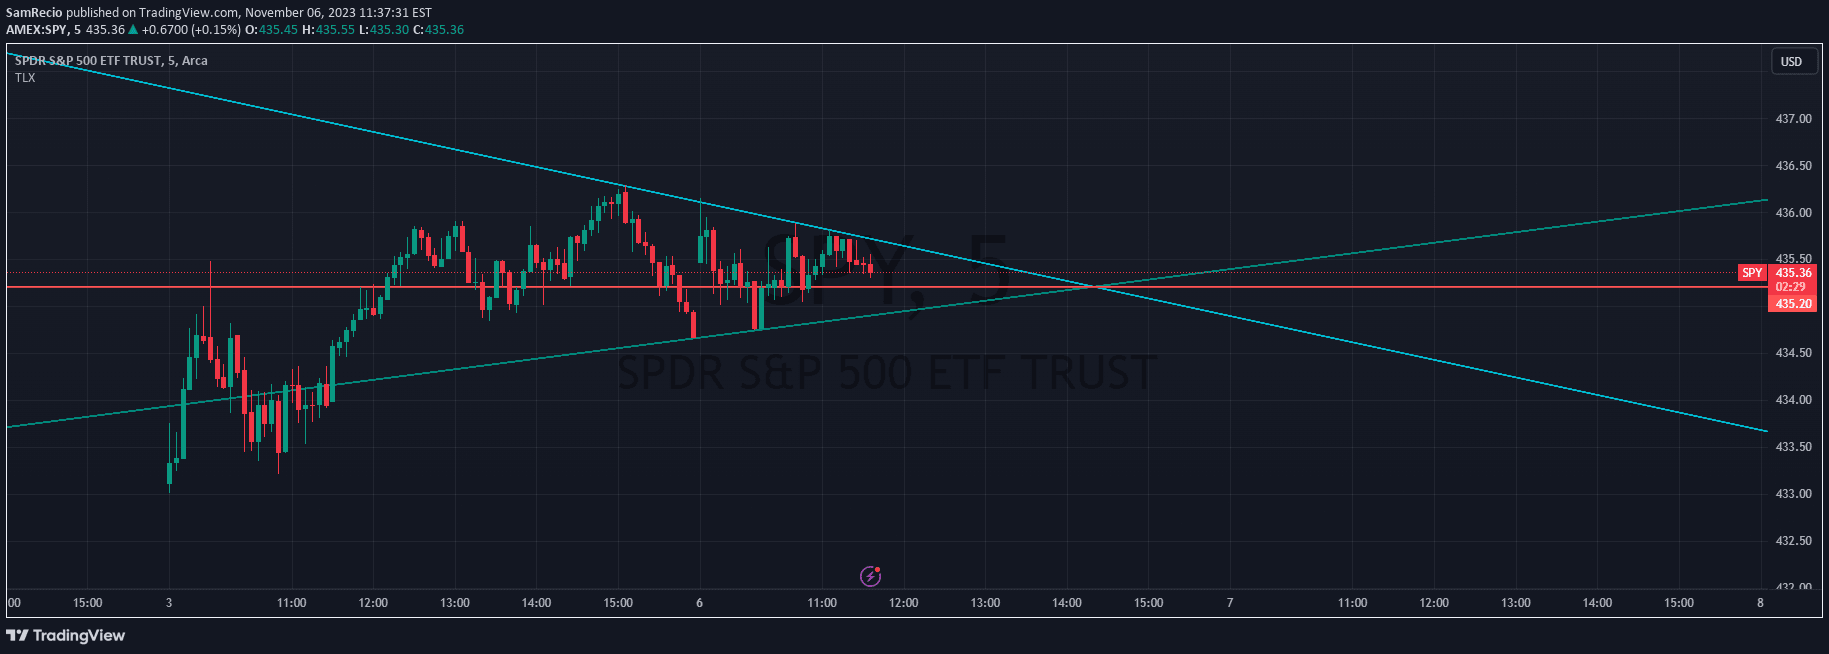
An automated trend line drawing tool that identifies key market levels by analyzing price strength and dynamically tracking multiple trend lines simultaneously.
Explore complementary indicator rolesHow it works
The trend line indicator employs an algorithmic approach to automatically draw trend lines based on specified top and bottom strengths in price action. It analyzes historical price data to identify significant highs and lows that meet predefined criteria for creating trend lines.
By utilizing multiple sets of trend lines, the tool can track various levels of market interest simultaneously. The system dynamically adjusts these lines, allowing for real-time tracking of potential support and resistance zones as price movement evolves.
Why it may be useful
Automated trend line drawing removes subjective manual interpretation, providing traders with objective and consistent trend identification. This approach helps traders quickly recognize potential market direction, support, and resistance levels without spending extensive time manually drawing trend lines.
The ability to generate multiple trend line sets enables traders to understand different market dynamics simultaneously. By offering dynamic line invalidation when price moves away, the indicator helps traders adapt quickly to changing market conditions and maintain an up-to-date view of potential price movements.
When to explore it
This trend line indicator is most effective in markets with clear directional movements and identifiable price trends. It works particularly well in liquid markets like forex, stocks, and cryptocurrency where price action tends to respect technical levels.
Traders should utilize this tool during periods of stable market conditions and when seeking to identify potential trend continuation or reversal points. It is especially useful for confirming entry and exit points across various timeframes, from short-term scalping to longer-term swing trading strategies.
Keep exploring
What we’ve verified
Access, alerts and repainting behaviour have not been independently verified for this indicator. Check the creator’s current publication and settings.
General descriptions and classifications are recovered research. Verified details above identify the specific checks we have completed. Check the creator’s current publication for later changes.