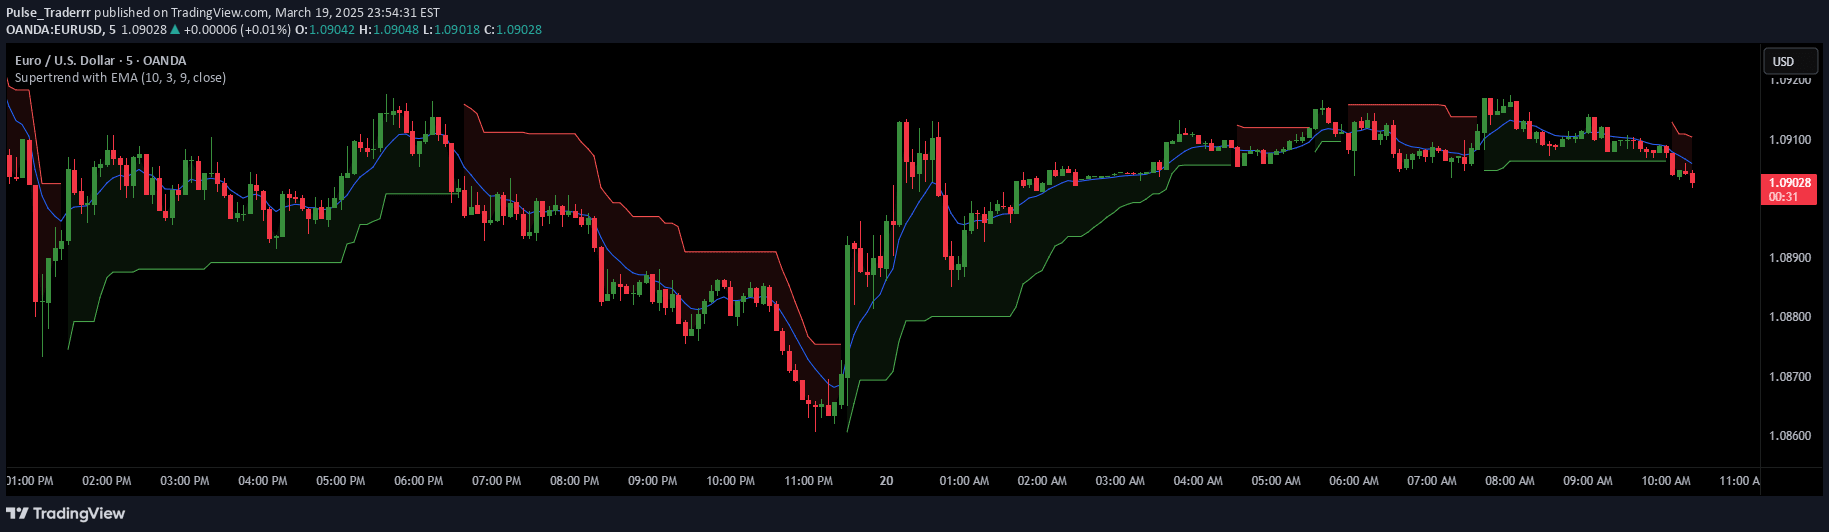
A 3-moving average crossover strategy that generates trading signals by tracking the relationship between fast, medium, and slow moving averages to identify trend direction and potential trade opportunities.
Explore complementary indicator rolesHow it works
The TrendBeads signal uses four different moving averages: a Price Proxy MA, Fast MA, Slow MA, and a Filter MA to analyze price trends. By comparing the positioning and crossover of these moving averages, the indicator generates color-coded 'beads' that represent different trend states and potential trading signals.
The signal looks at the relative positioning of the moving averages to determine trend direction. When the fast MA crosses above the medium MA and both are above the slow MA, it suggests an uptrend. Conversely, when the fast MA crosses below the medium MA and both are below the slow MA, it indicates a potential downtrend.
Why it may be useful
The TrendBeads signal provides traders with a simple, visual method to quickly identify market trends and potential trading opportunities. By reducing chart complexity and using color-coded indicators, traders can rapidly assess market conditions without getting overwhelmed by multiple technical indicators.
The signal's preset templates offer traders quick access to commonly used moving average configurations, saving time and providing a standardized approach to trend analysis. This approach helps traders focus on key trend changes and potential entry or exit points across different trading timeframes.
When to explore it
The TrendBeads signal is most effective when used across multiple timeframes and in conjunction with other technical analysis tools. It works particularly well for traders seeking a straightforward trend identification method that can be quickly applied to different trading styles and market conditions.
Traders should use this signal during trending markets and be cautious during periods of consolidation. It is especially useful for identifying potential trend reversals, confirming existing trends, and providing visual cues about market momentum across short-term, swing, and long-term trading strategies.
Keep exploring
What we’ve verified
Access, alerts and repainting behaviour have not been independently verified for this indicator. Check the creator’s current publication and settings.
General descriptions and classifications are recovered research. Verified details above identify the specific checks we have completed. Check the creator’s current publication for later changes.