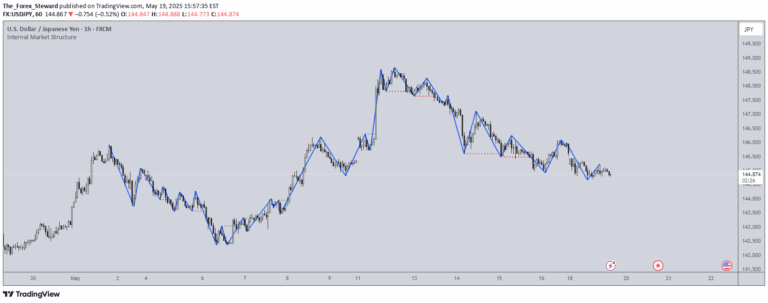
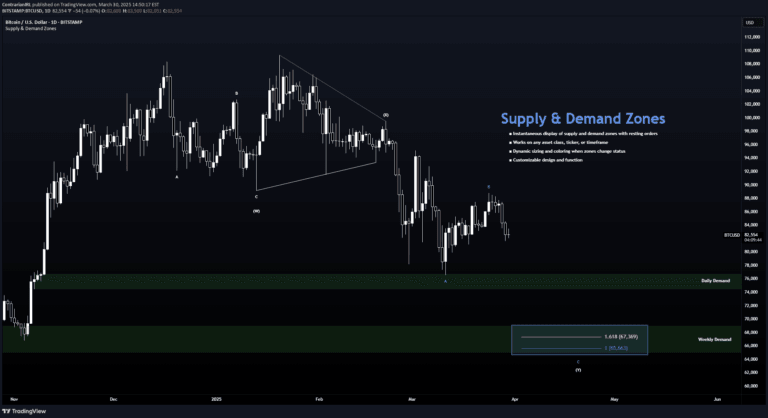
An advanced trading indicator that identifies institutional order blocks and internal market structure shifts to help traders recognize potential trend reversals and key trading zones.
Explore complementary indicator rolesHow it works
The indicator analyzes price action to detect specific market structure shifts and order blocks through sophisticated algorithmic detection. It identifies bullish and bearish engulfing conditions that signal potential institutional interest zones, plotting these areas with color-coded shaded boxes.
By tracking internal structure shifts with small black triangles, the tool provides early warning signals of potential trend changes. When price breaks previous opposing structure, the indicator marks these engulfing breakouts, offering visual confirmation of new directional market intent.
Why it may be useful
This tool provides traders with a visual mapping of key structural changes in the market, helping them identify zones of potential institutional activity and interest. By highlighting order blocks and structure shifts, it offers insights into potential trend reversals and market sentiment that might not be immediately apparent.
The indicator serves as a complementary analysis tool, giving traders an additional perspective on market dynamics. It helps traders understand potential entry and exit points by revealing underlying market structure and potential institutional trading zones.
When to explore it
The indicator works best in markets with clear trending behavior and sufficient price action volatility. Traders can utilize it across multiple timeframes, from short-term scalping to longer-term swing trading strategies, making it versatile for different trading approaches.
It is particularly effective when combined with other technical analysis tools and a trader's existing strategy. Traders should use it as a supplementary tool to confirm potential trade setups, rather than as a standalone trading system, always incorporating their own analysis and risk management.
Keep exploring
What we’ve verified
Access, alerts and repainting behaviour have not been independently verified for this indicator. Check the creator’s current publication and settings.
General descriptions and classifications are recovered research. Verified details above identify the specific checks we have completed. Check the creator’s current publication for later changes.