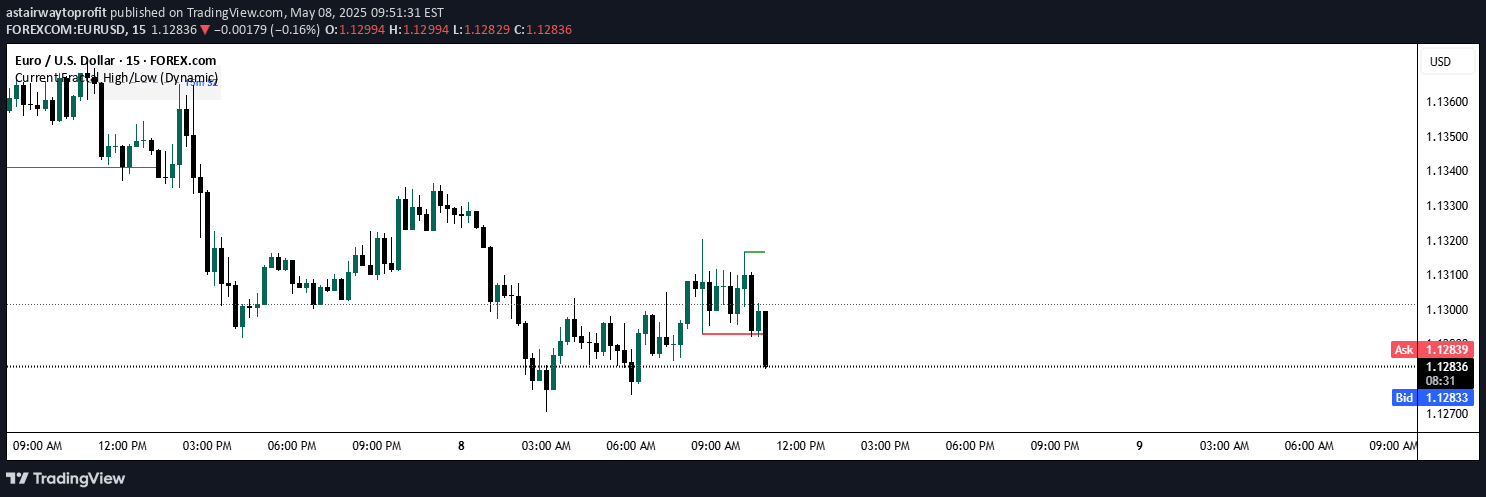
An advanced indicator that automatically identifies dynamic support and resistance zones based on pivot high and low points, helping traders visualize potential price reversal and breakout areas.
Explore complementary indicator rolesHow it works
The script calculates support and resistance levels by tracking pivot high and low points in price action. It uses a user-defined minimum number of touches to validate these levels, creating zones that represent potential price interaction areas.
The indicator also allows customization of zone buffer size, either using a default 50% of the 1000-period ATR or a manually set buffer. By analyzing price interactions with these zones, traders can identify key levels where price may potentially reverse or break through.
Why it may be useful
Support and resistance zones are critical for understanding market psychology and potential price movements. By automatically identifying these dynamic levels, traders can make more informed decisions about entry, exit, and risk management strategies.
The indicator provides a visual representation of market structure, helping traders recognize key price levels where buying or selling pressure might increase. This systematic approach reduces emotional trading and provides a structured method for analyzing market dynamics.
When to explore it
This indicator works best in markets with clear trending or ranging behavior, where price repeatedly tests specific levels. It is particularly useful in liquid markets like forex, stocks, and cryptocurrencies where price action tends to respect key support and resistance zones.
Traders should use this indicator in conjunction with other technical analysis tools to confirm signals and improve trade probability. It is most effective on timeframes from 1-minute to daily charts, providing insights for scalpers, day traders, and swing traders alike.
Keep exploring
What we’ve verified
Access, alerts and repainting behaviour have not been independently verified for this indicator. Check the creator’s current publication and settings.
General descriptions and classifications are recovered research. Verified details above identify the specific checks we have completed. Check the creator’s current publication for later changes.